Trade with Confidence. Leave Emotions Behind.

The Blue-Collar Trader

Book Supplements & Resources

Chapter 1: How I Learned to Trade

https://www.tradingview.com/x/qLx2n4jU/
Figure 1: Daily Chart
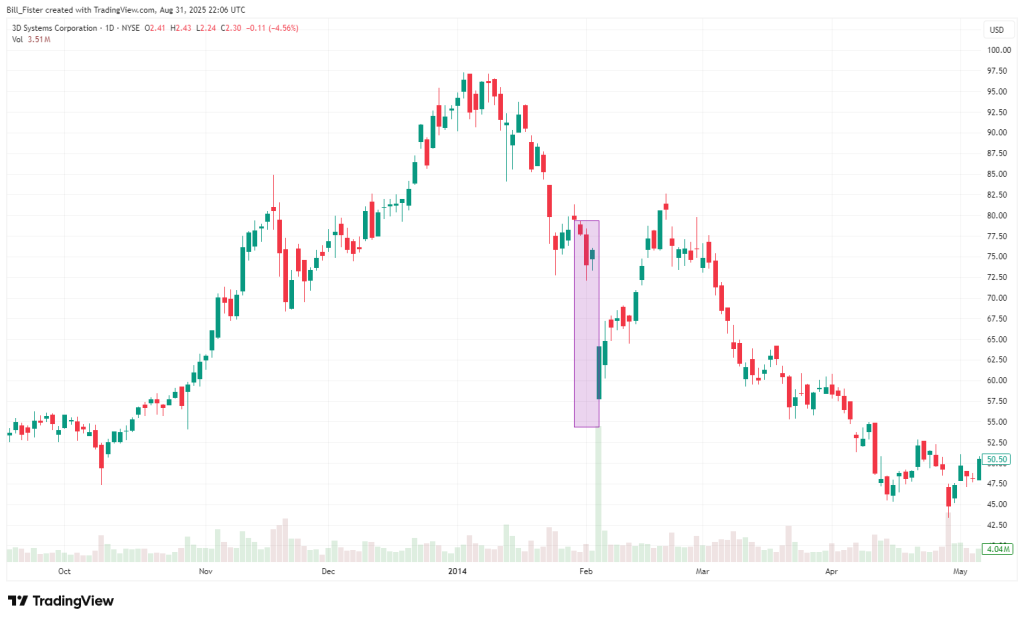
3D Systems Corporation Chart Courtesy of TradingView
Figure 2: Daily Chart
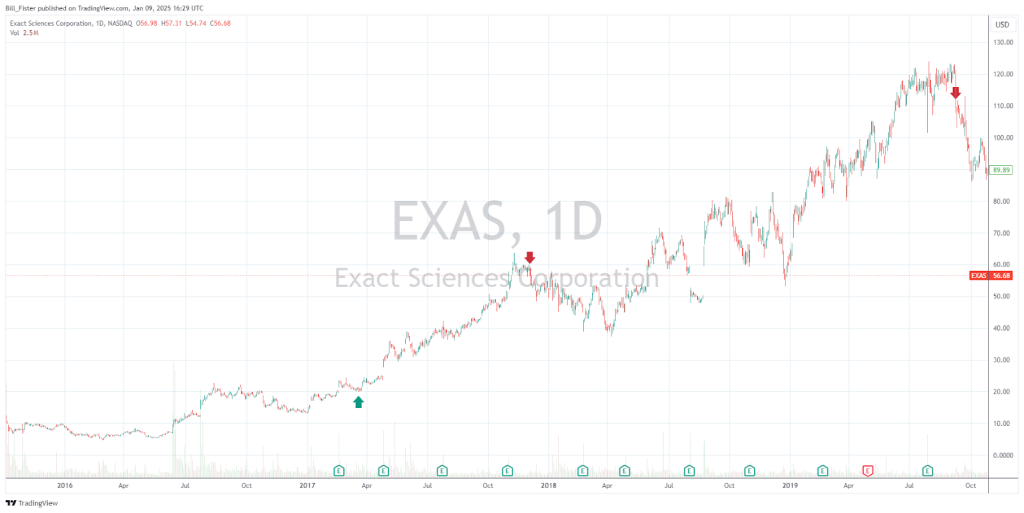
Exact Sciences Corporation Chart Courtesy of TradingView
 
Figure 3: Daily Chart
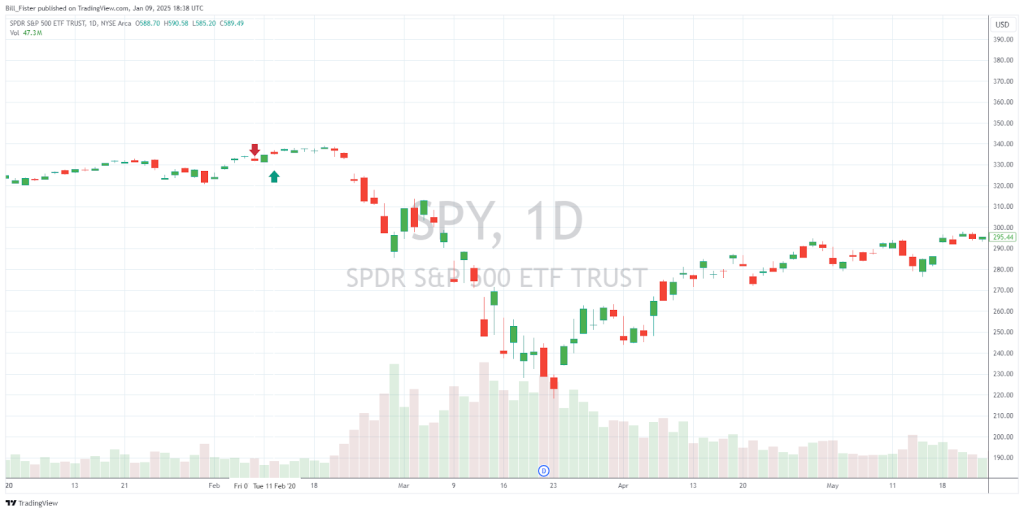
SPDR S&P 500 ETF Trust Chart Courtesy of TradingView
 
https://www.tradingview.com/x/Yuk0f38I/
Figure 4: Daily Chart
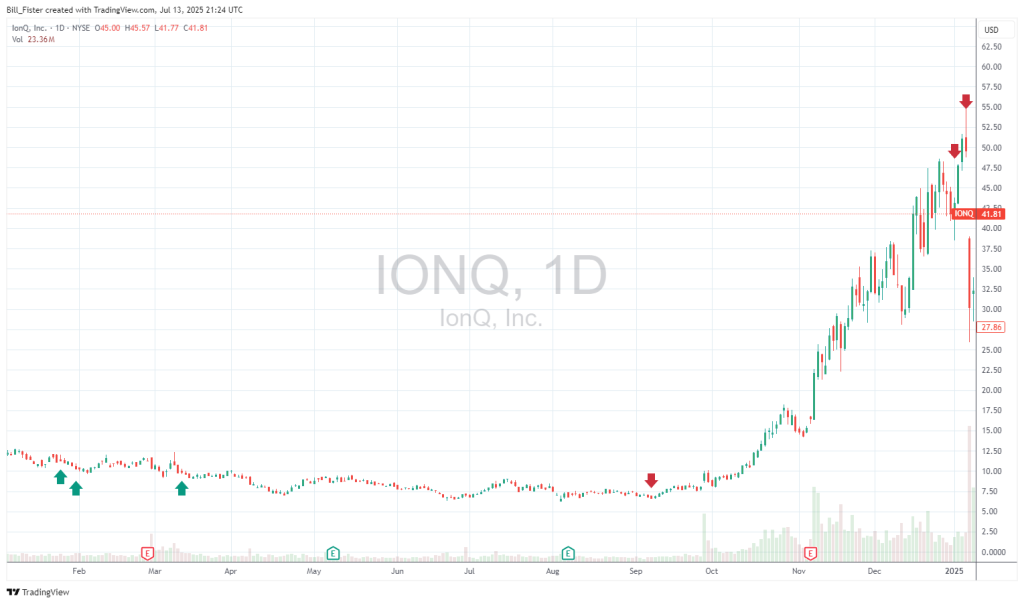
IonQ, Inc. Chart Courtesy of TradingView
Figure 5
 
Figure 6


Chapter 4: Navigating the Landscape of Financial Beliefs

https://www.tradingview.com/u/CoryMitchell-CMT/
Figure 7: Chart Courtesy of Cory Mitchel-CMT

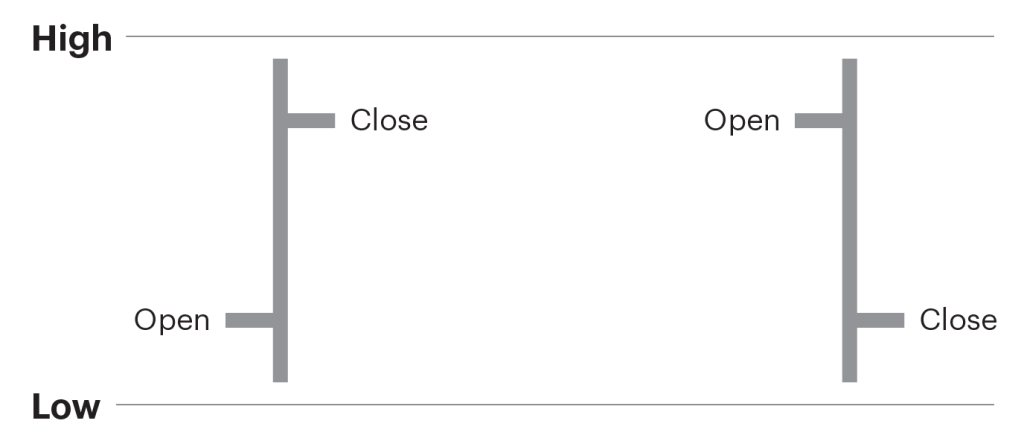
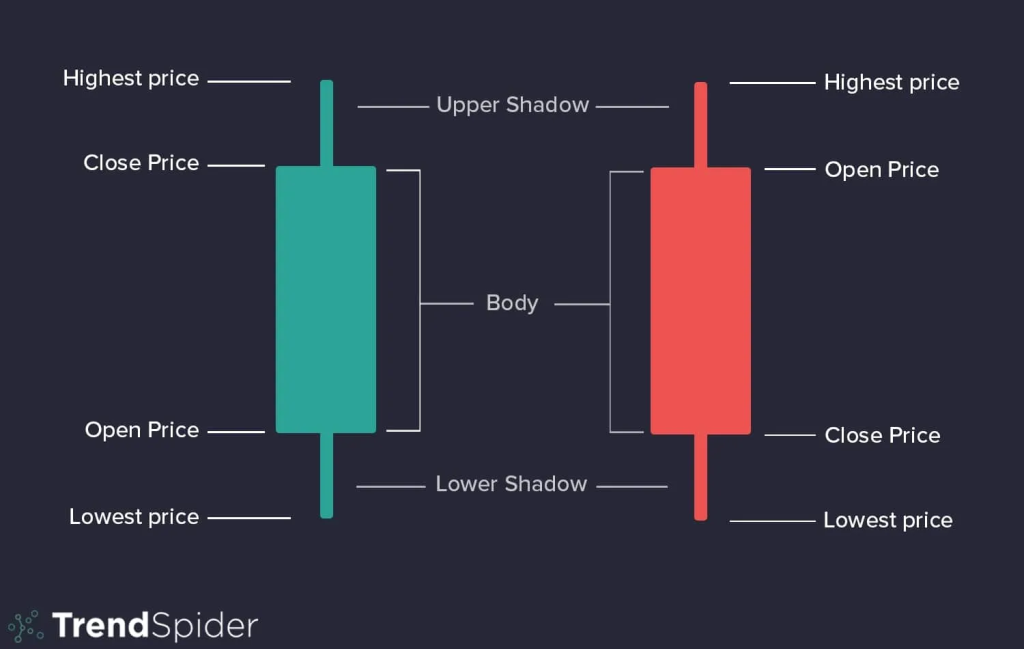
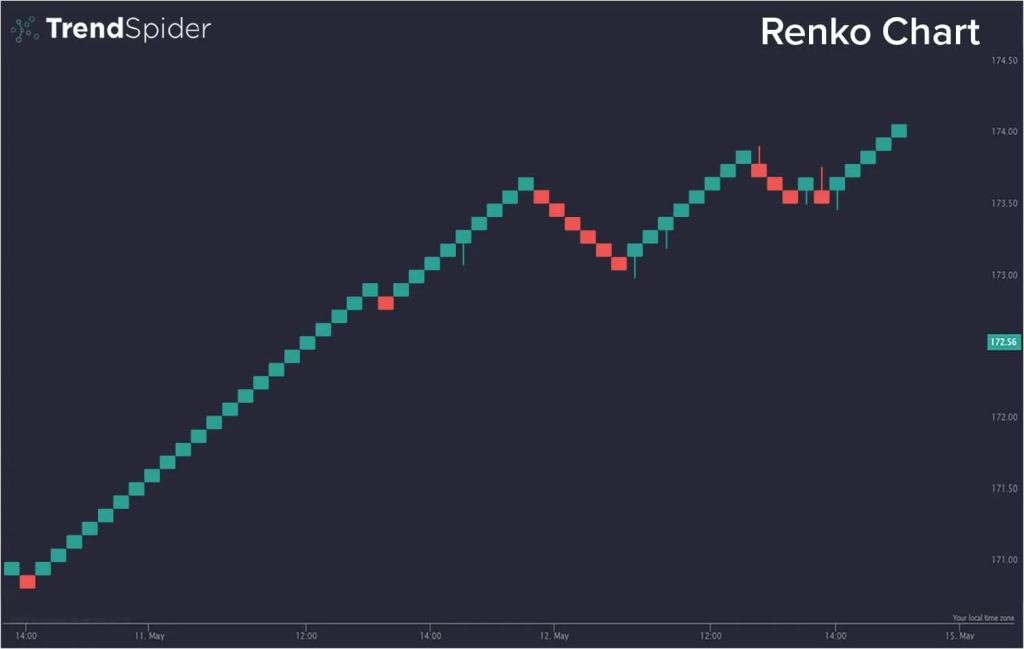
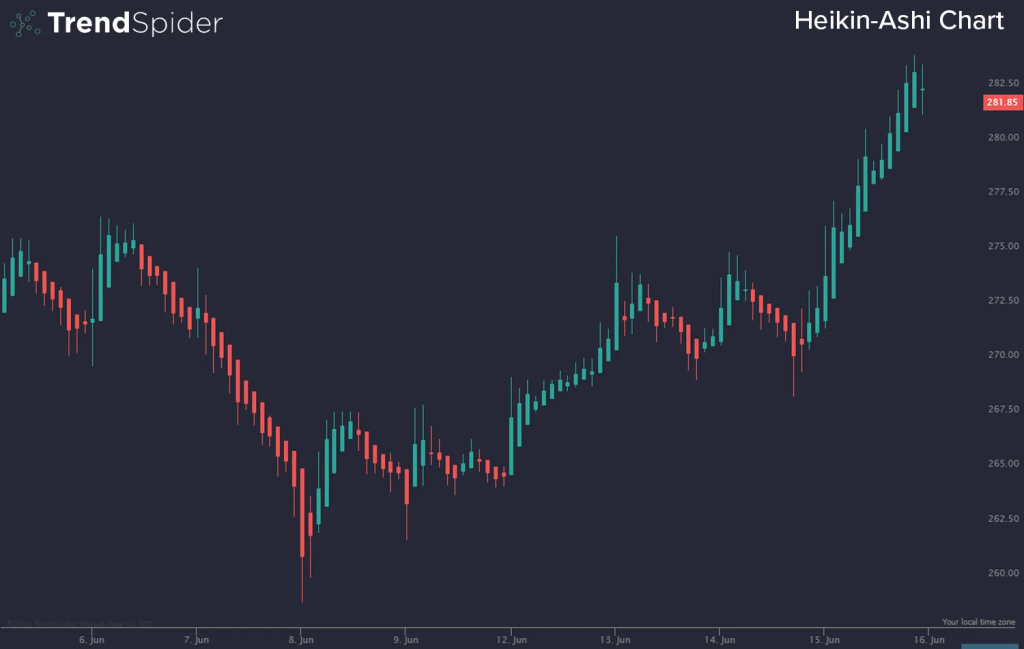
Chapter 7: Introduction to Technical Analysis and Chart Types

Figure 8: Daily Chart – October, 2022 – January, 2025
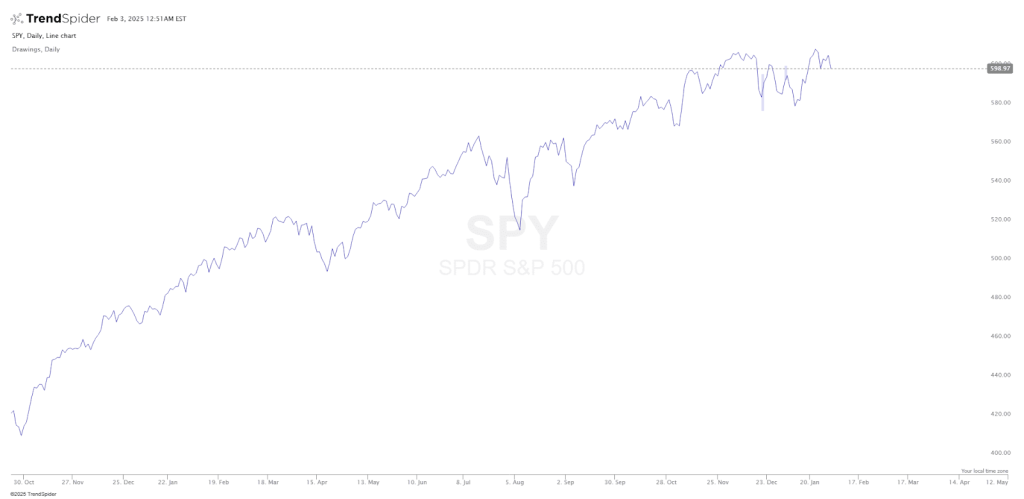
SPDR S&P 500 ETF Trust Chart Courtesy of TrendSpider
 

https://share.trendspider.com/chart/QQQ/1339124v2il
Figure 9: Weekly Chart Analysis- January 2022 – January 2023
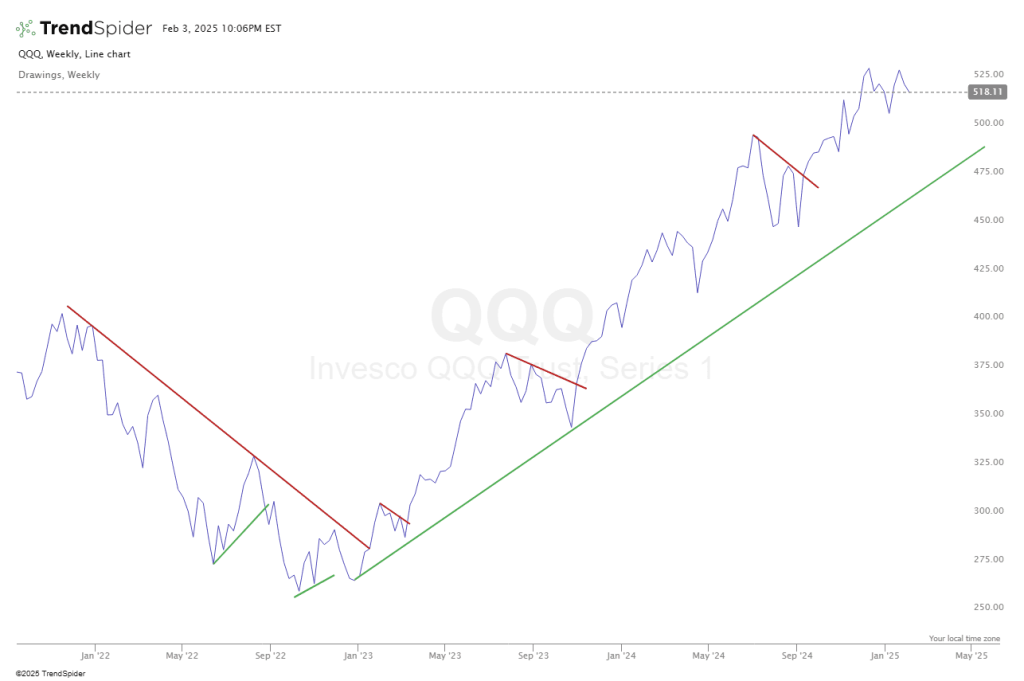
Invesco QQQ Trust Chart Courtesy of TrendSpider
 
https://us.etrade.com/knowledge/library/stocks/understanding-technical-analysis-charts
Figure 10: Bar Chart Example Courtesy of Etrade
 

https://trendspider.com/learning-center/what-are-candlestick-patterns/
Figure 11: Candlestick Chart Courtesy of TrendSpider
 

https://www.youtube.com/watch?v=XuhQhQid1bc
Figure 12: Point & Figure Chart Courtesy of TradingView


https://trendspider.com/learning-center/what-are-renko-charts/
Figure 13: Renko Chart Courtesy of TrendSpider
 

https://trendspider.com/blog/volume-indicators-and-strategies-for-traders/
Figure 15: Volume Indicator Courtesy of TrendSpider
 

https://trendspider.com/learning-center/anchored-volume-by-price/
Figure 16: Volume-by-Price Chart Courtesy of TrendSpider

https://trendspider.com/learning-center/what-are-raindrop-charts/
Figure 17: Raindrop Chart Courtesy of TrendSpider

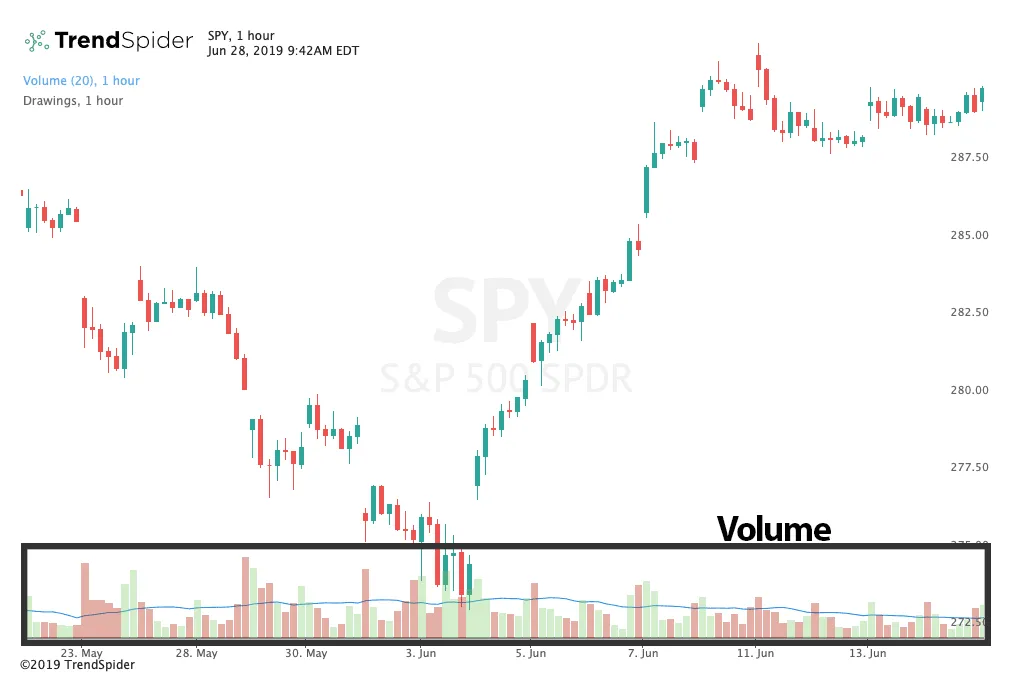
Chapter 8: Understanding Support, Resistance, Trendlines and Volume


https://share.trendspider.com/chart/AAPL/13391ww8e80
Figure 18: Daily Chart Analysis- January 27 – January 31
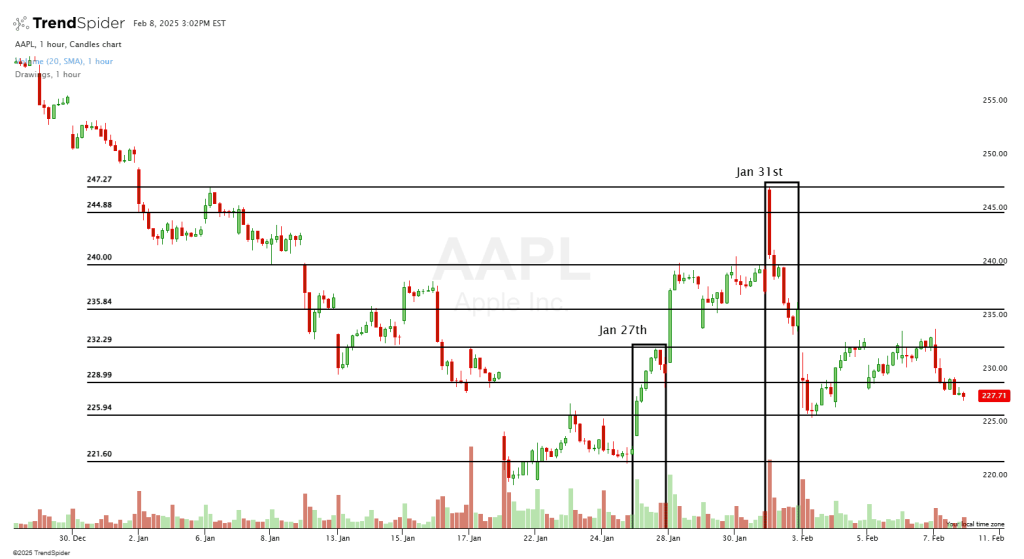
Apple Inc. Chart Courtesy of TrendSpider
 

https://share.trendspider.com/chart/KMI/13391wx1occ
Figure 19: Daily Chart Analysis- July 2, 2024 – February 7, 2025
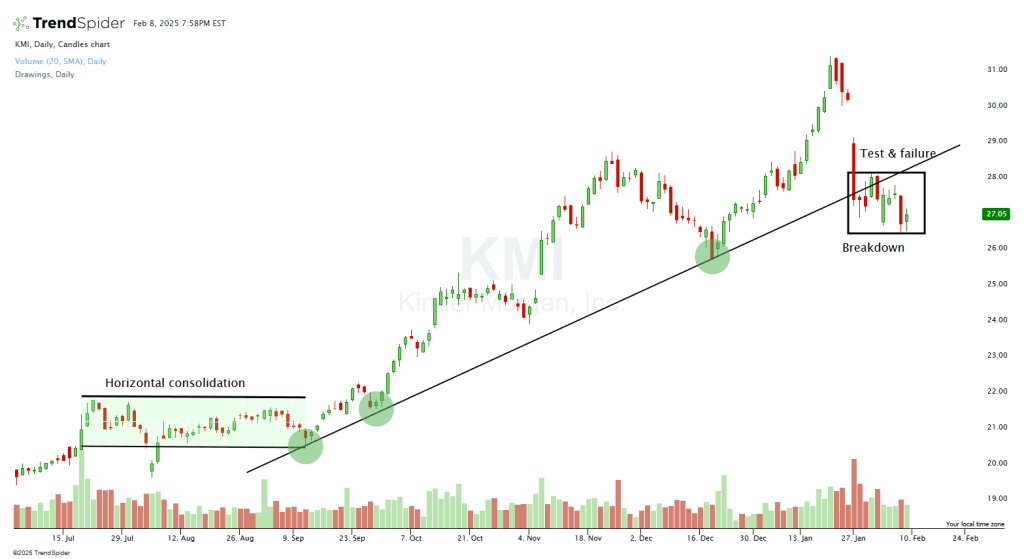
KMI Chart Courtesy of TrendSpider
 

https://share.trendspider.com/chart/MRK/13391wy8ark
Figure 20: Daily Chart Analysis- March 25, 2024 – February 7, 2025
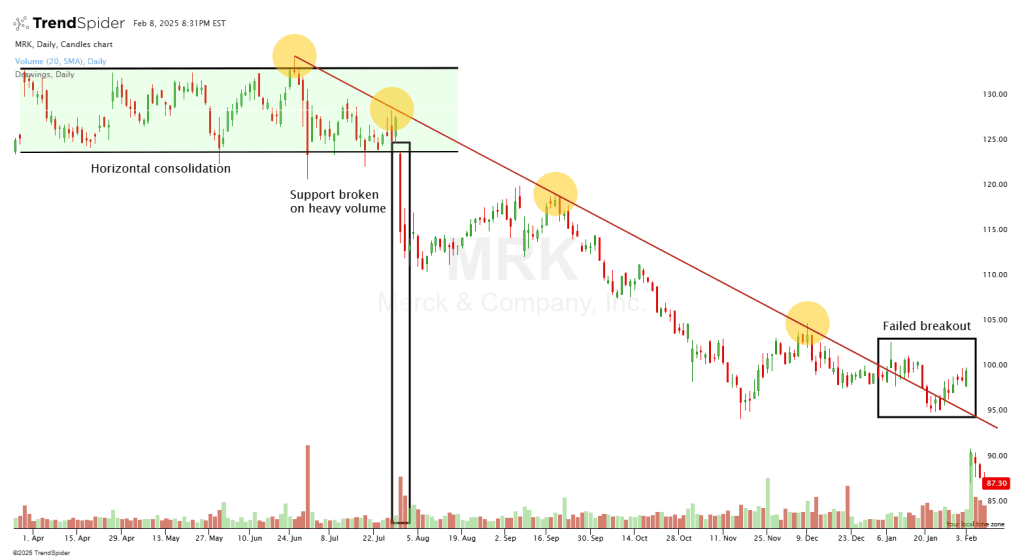
MRK Chart Courtesy of TrendSpider
 

https://share.trendspider.com/chart/IBM/13391x0guby
Figure 21: Daily Chart Analysis- February 29, 2024 – November 14, 2024
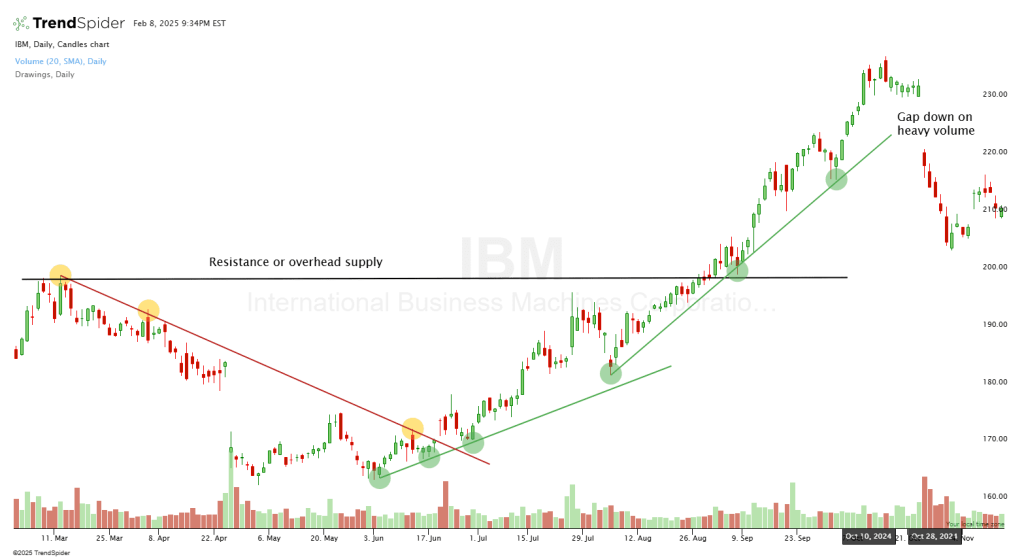
IBM Chart Courtesy of TrendSpider
 

https://share.trendspider.com/chart/AI/133912v7cg4
Figure 22: Daily Chart Analysis- February 23, 2023 – February 22, 2024
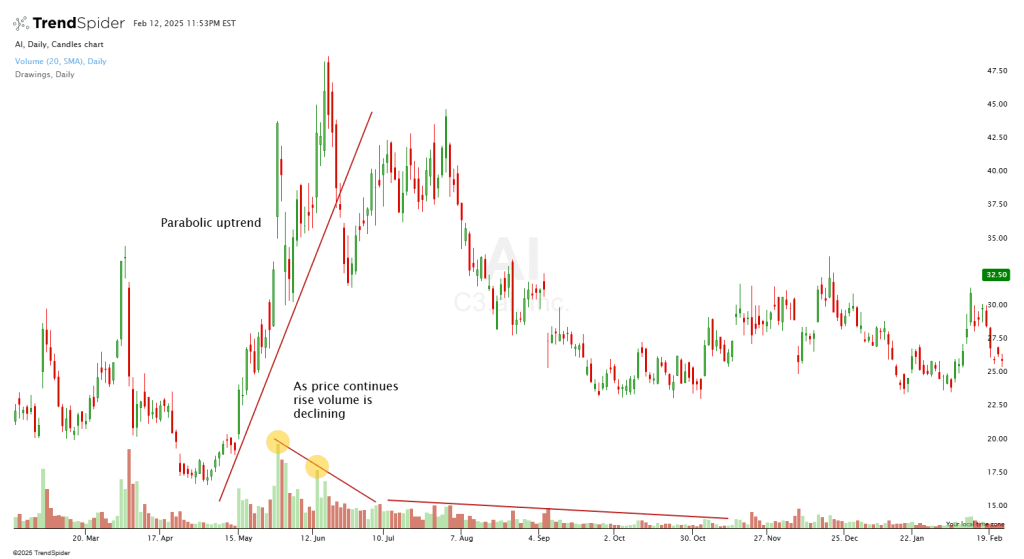
C3Ai Chart Courtesy of TrendSpider
 

https://share.trendspider.com/chart/IONQ/13391yaabwy
Figure 23: Daily Chart Analysis- March 21, 2024 – January 22, 2025
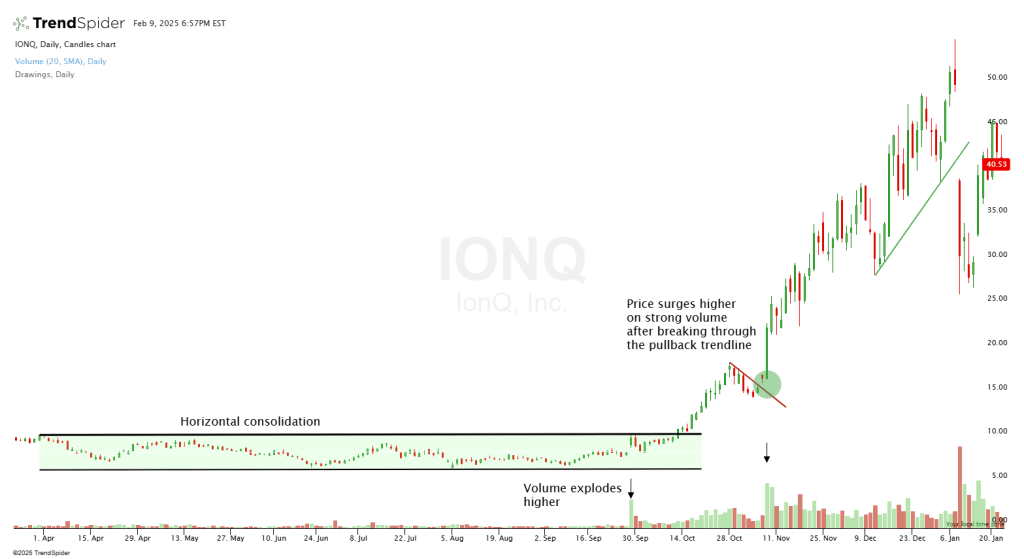
IONQ Chart Courtesy of TrendSpider
 

https://share.trendspider.com/chart/ROKU/1339175bf7z
Figure 24: Daily Chart Analysis- October 26, 2020 – March 4, 2022
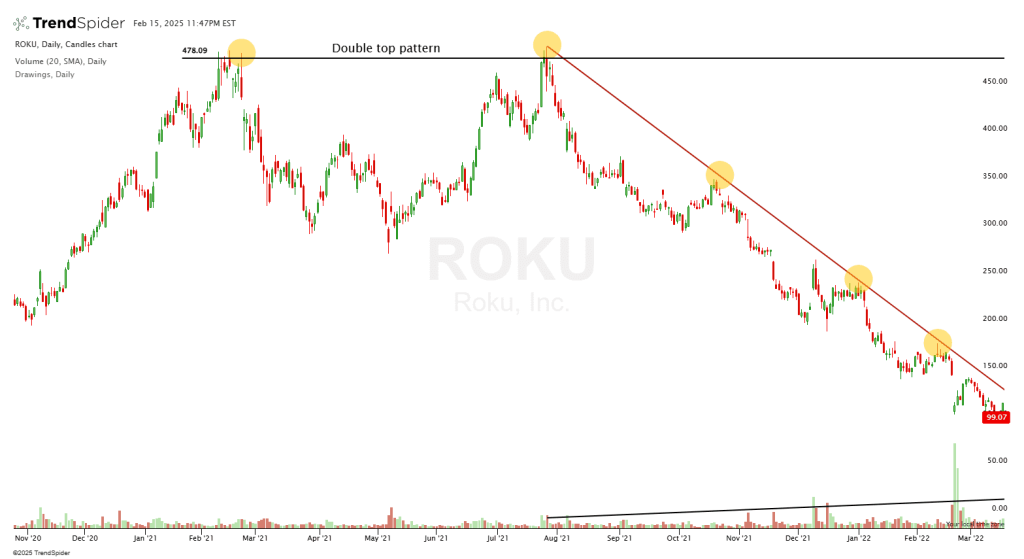
Roku Inc. Chart Courtesy of TrendSpider
 

https://share.trendspider.com/chart/SNOW/1339176w7ni
Figure 25: Hourly Chart Analysis- November 29, 2024 – February 14, 2025
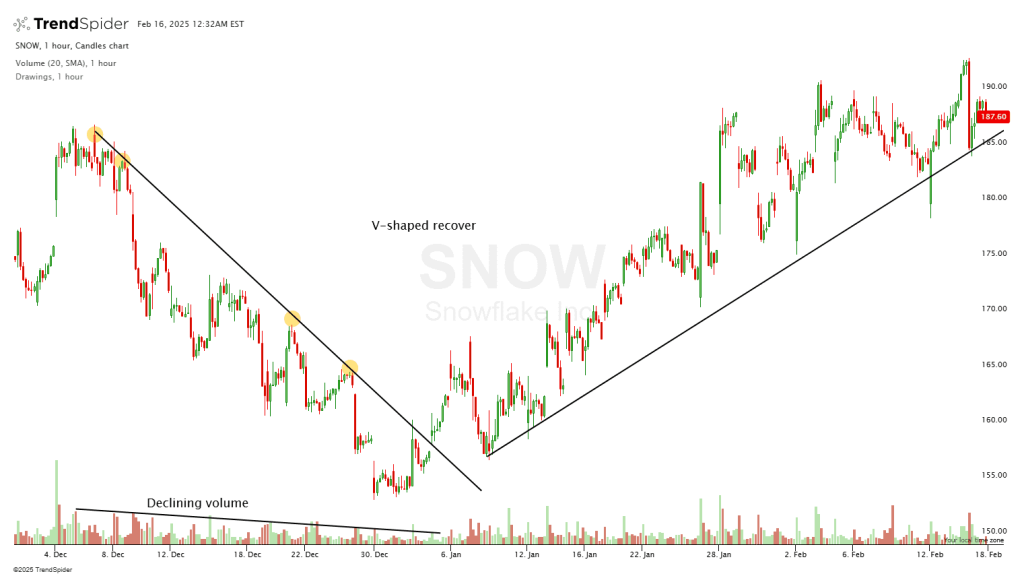
Snowflake Inc. Chart Courtesy of TrendSpider
 

https://share.trendspider.com/chart/SEDG/13391eanyff
Figure 26: Daily Chart Analysis – July 22, 2024 – February 20, 2025
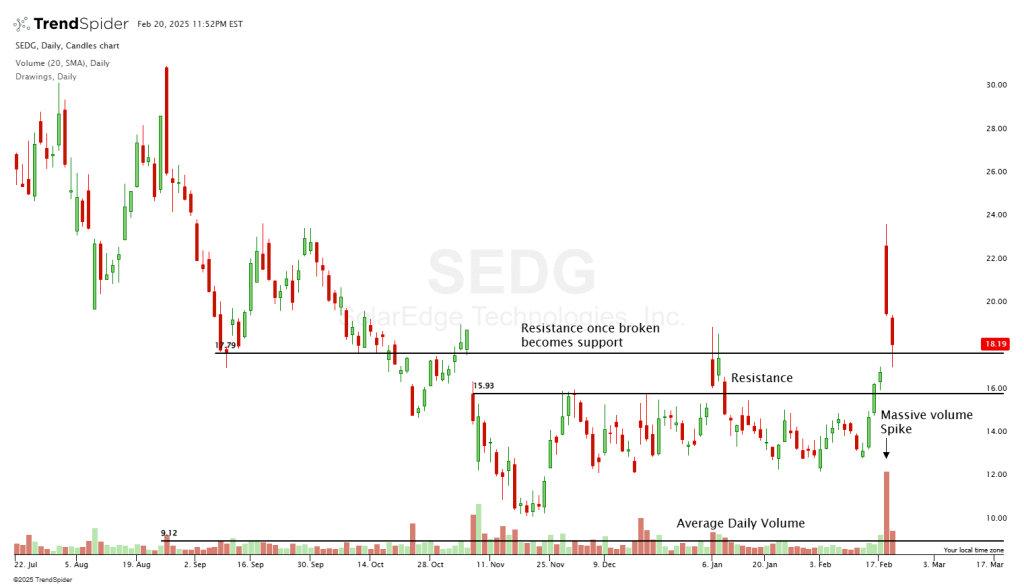
Solar Edge. Chart Courtesy of TrendSpider

https://share.trendspider.com/chart/NVAX/13391i8x7a8
Figure 27: Hourly Chart – July 7, 2025 – January 29, 2025
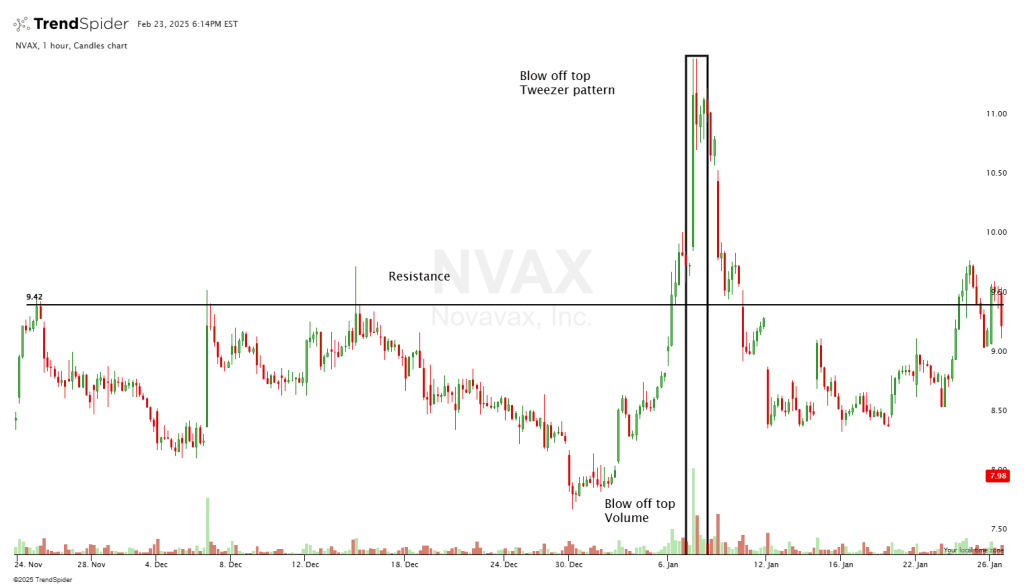
Novavax, Inc Chart Courtesy of TrendSpider
 

https://share.trendspider.com/chart/RBLX/13391jcivol
Figure 28: 5-Minute Chart Analysis- February 4, 2025 – February 7, 2025
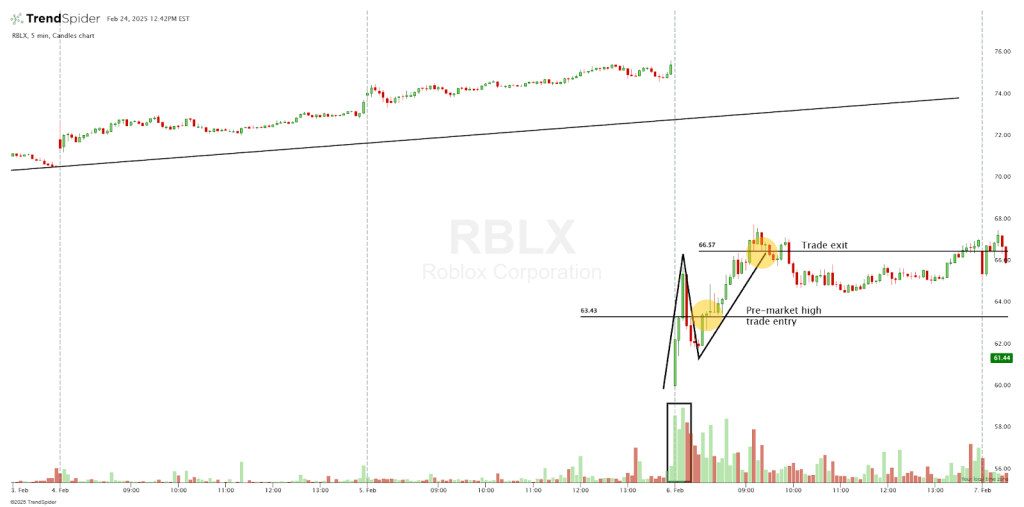
Roblox Corporation (RBLX) Chart Analysis Courtesy of TrendSpider


https://share.trendspider.com/chart/INTC/13391ko4lsd
Figure 29: Daily Chart Analysis- July, 2024 – February 25, 2025
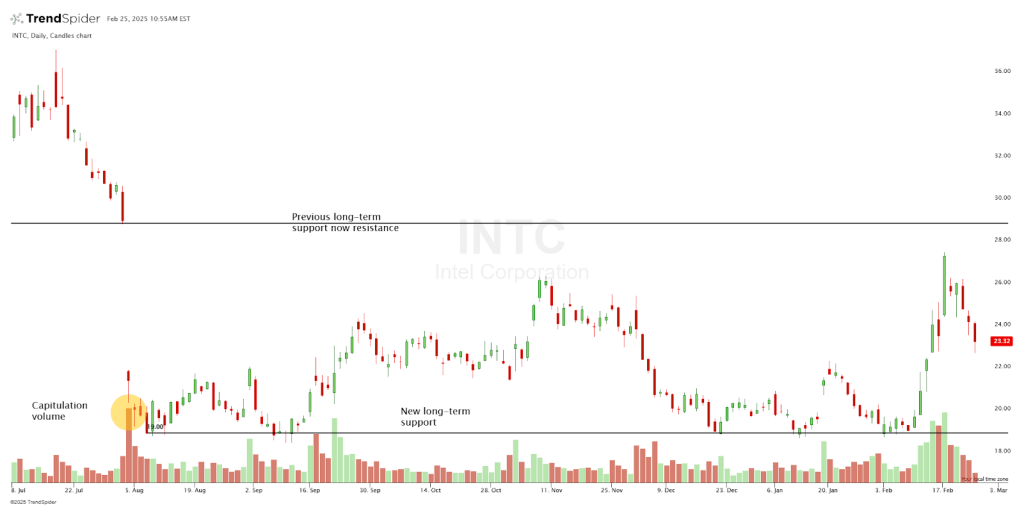
Intel Corp(INTC) Chart Courtesy of TrendSpider

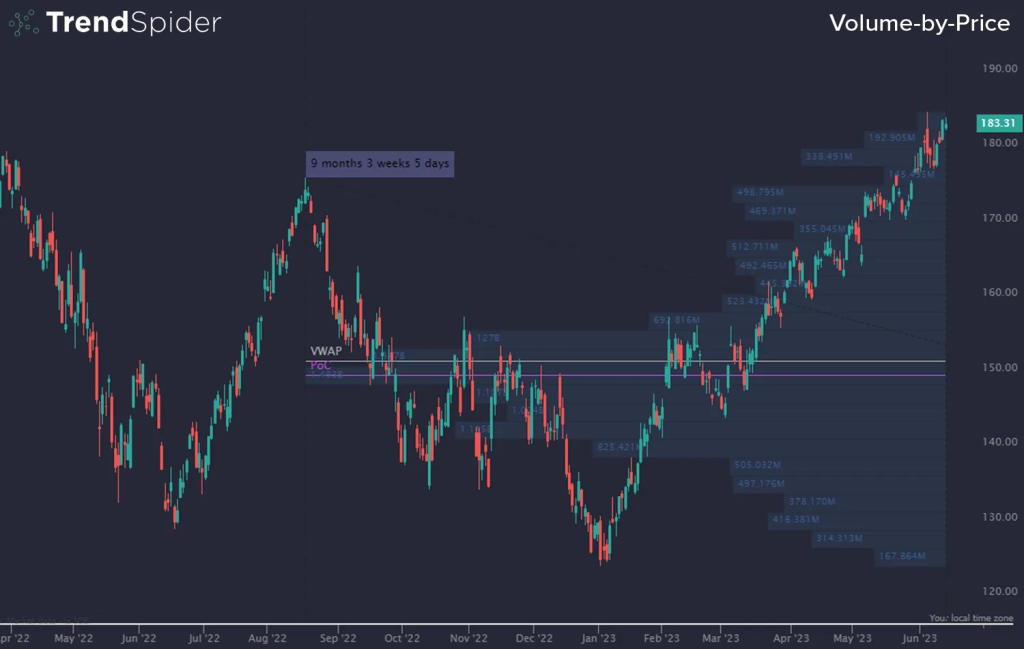
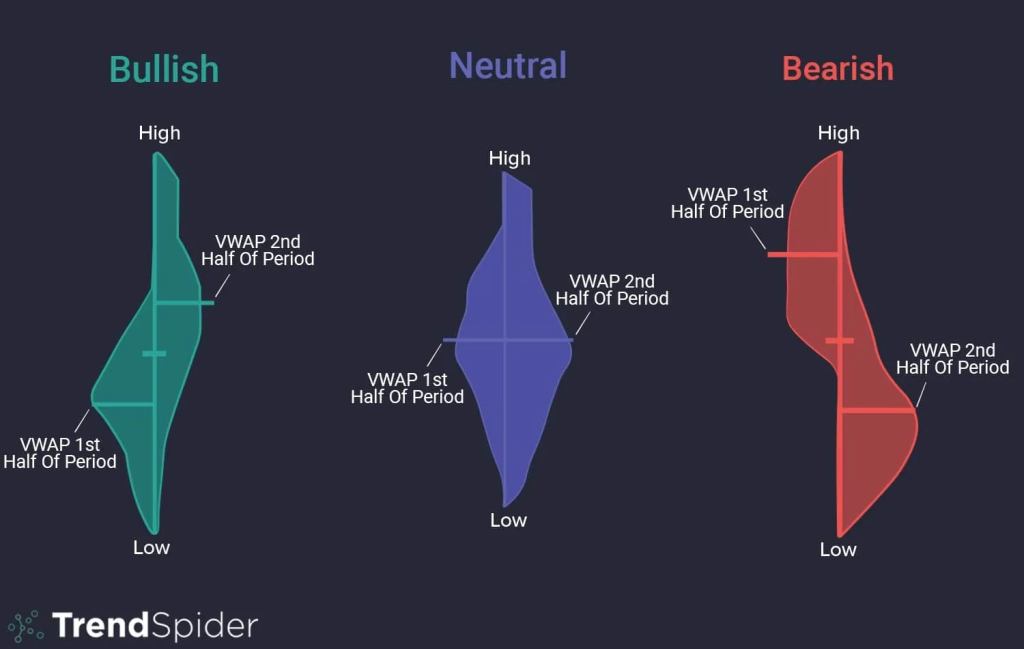
Chapter 9: Trading with Volume and Trend Tools


https://share.trendspider.com/chart/MES1_/13391r09q3z
Figure 30: 5-Minute Chart Analysis – February 28, 2025
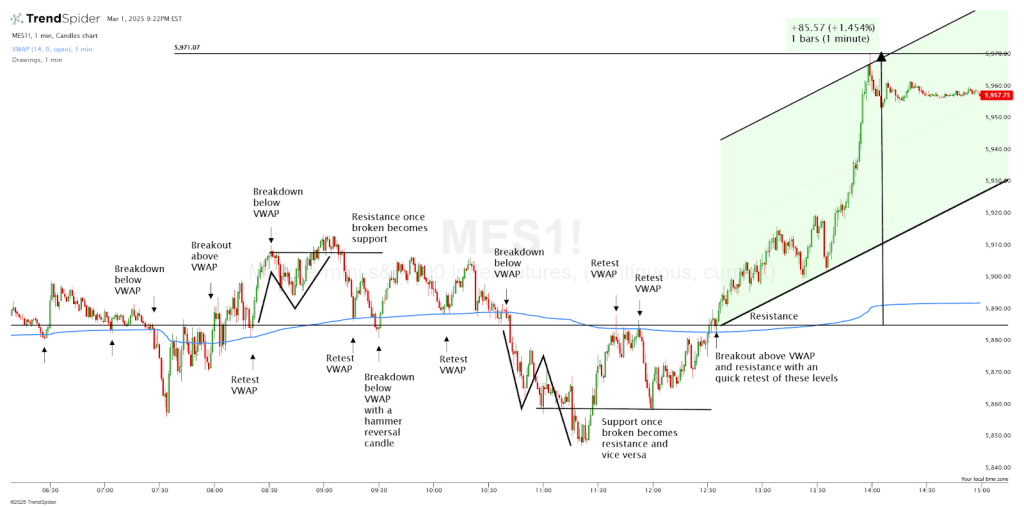
Micro E-Mini S&P 500 Futures Chart Courtesy of TrendSpider
 

https://share.trendspider.com/chart/BAC/13391sbl91a
Figure 31: Daily Chart Analysis- December 13, 2022 – February 28, 2025
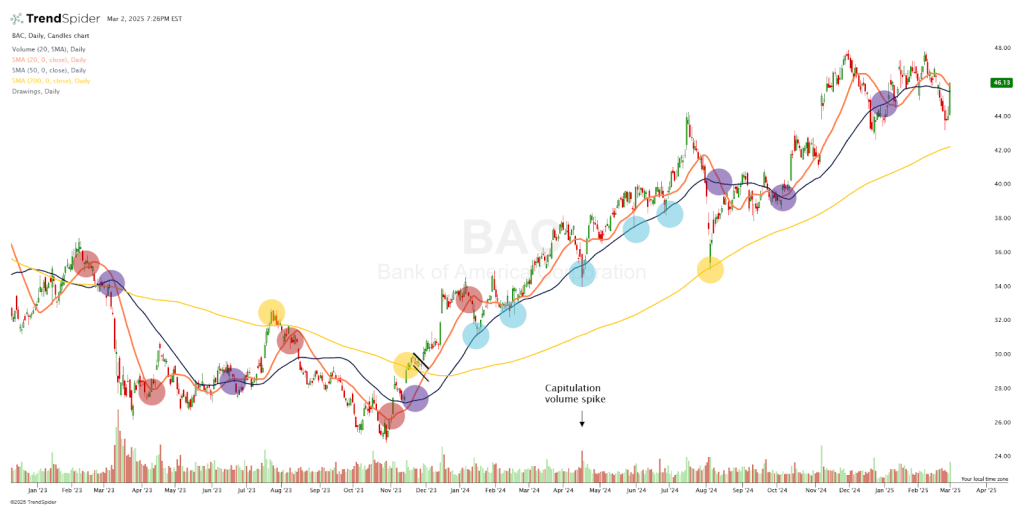
Bank of America (BAC) Chart Courtesy of TrendSpider
 
https://share.trendspider.com/chart/BAC/13391vhw7vg
Figure 32: Hourly Chart Analysis- October 3, 2024 – December 12, 2024
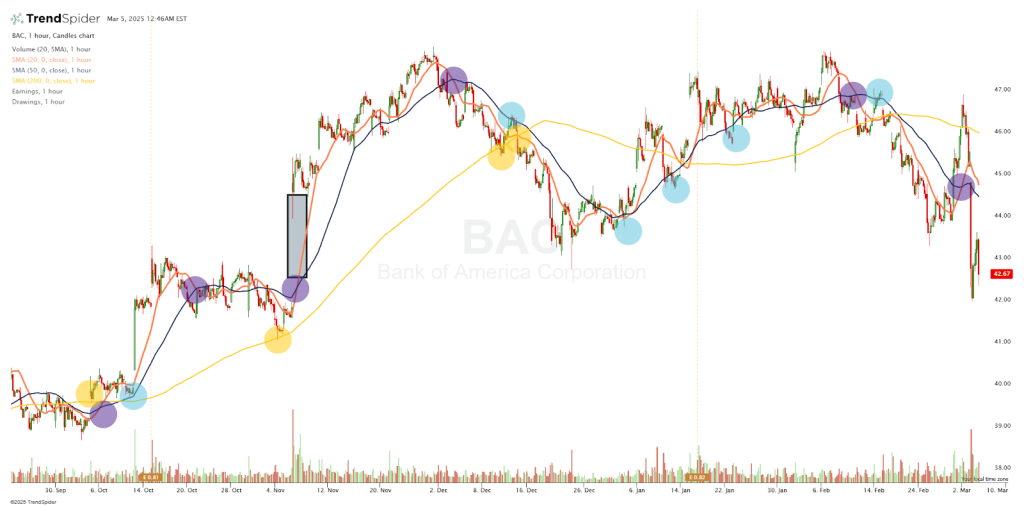
Bank of America Corporation (BAC) Chart Courtesy of TrendSpider
 

https://share.trendspider.com/chart/ORCL/13391yau5yg
Figure 33: Daily Chart Analysis- February 23, 2022 – March 5, 2025
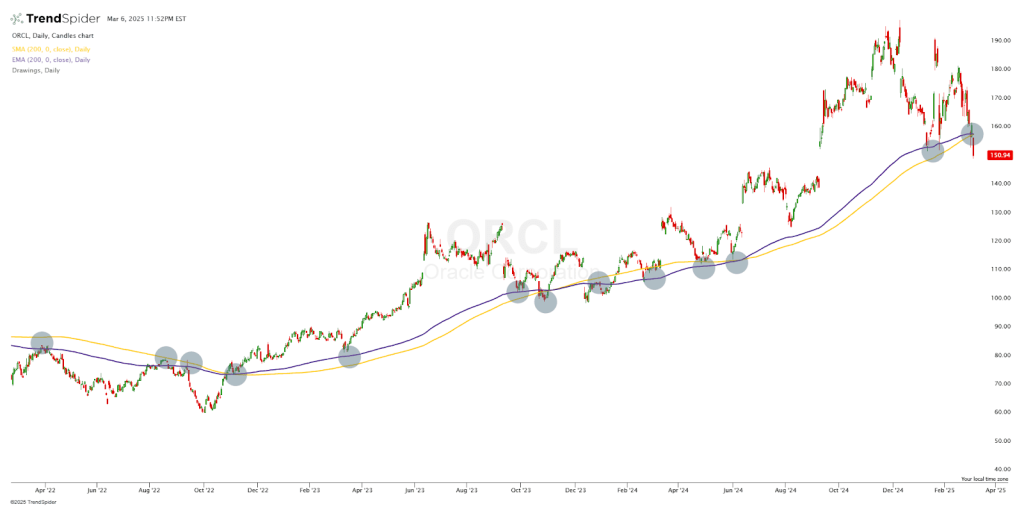
Oracle Corporation Chart Courtesy of TrendSpider
 
https://share.trendspider.com/chart/CZR/13391yd0gss
Figure 34: 10-Minute Chart Analysis- February 28, 2025 – March 7, 2025
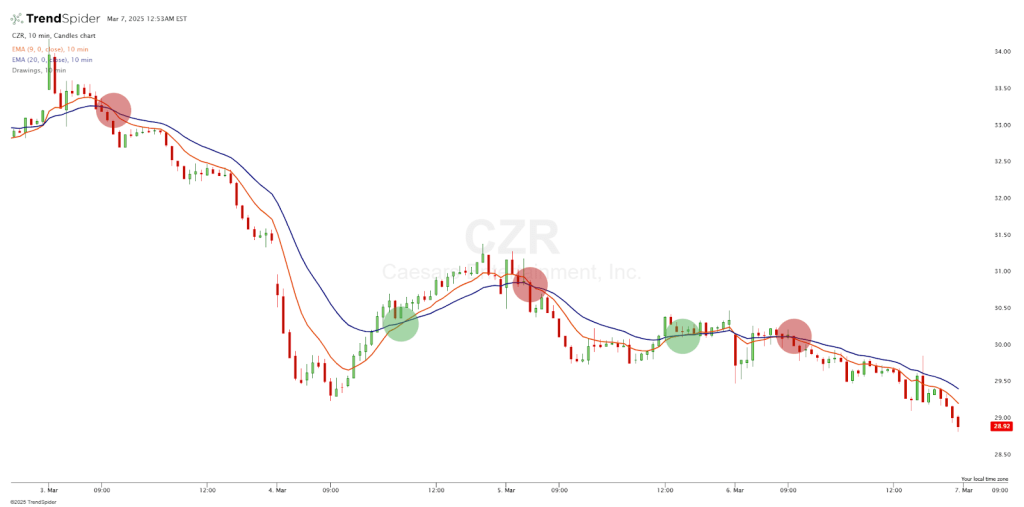
Caesars Entertainment, Inc. Chart Courtesy of TrendSpider
 
https://share.trendspider.com/chart/BUG/133910yuf2z
Figure 35: Hourly Chart Analysis- January 6, 2025 – March 7, 2025
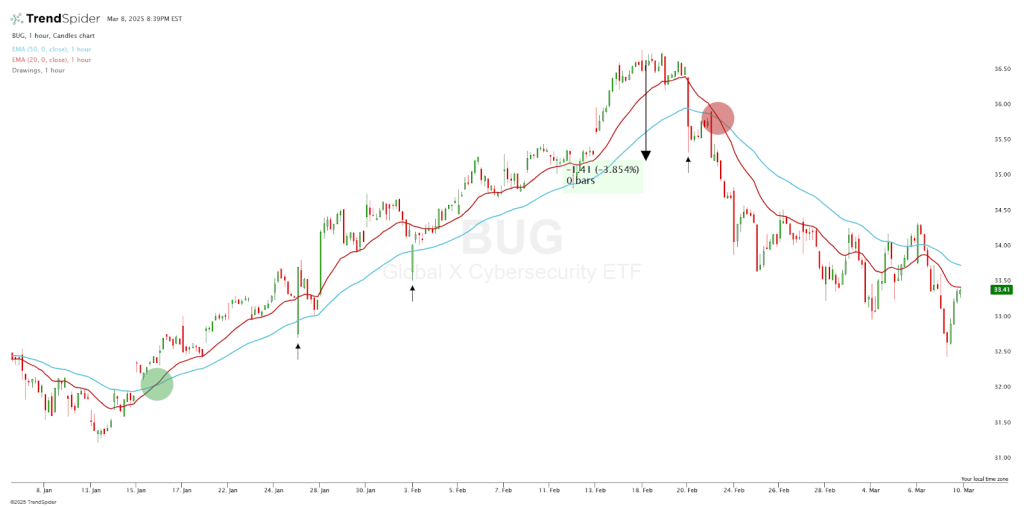
Global Cybersecurity ETF (BUG) Chart Courtesy of TrendSpider
 
https://share.trendspider.com/chart/TRMB/13391198th5
Figure 36: Weekly Chart Analysis- July 11, 2016 – July 24, 2024
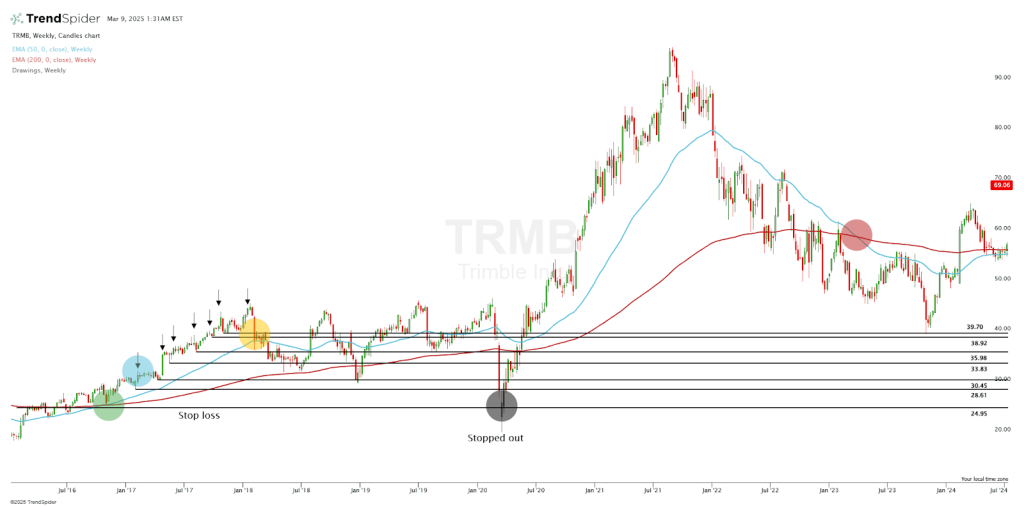
Trimble, Inc. (TRMB) Chart Courtesy of TrendSpider


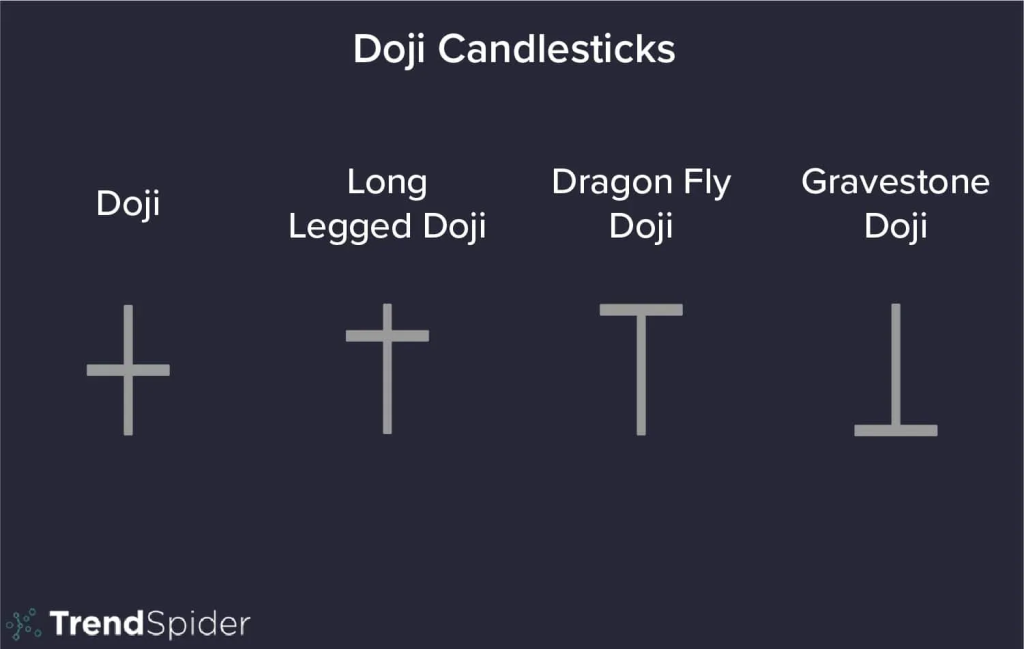
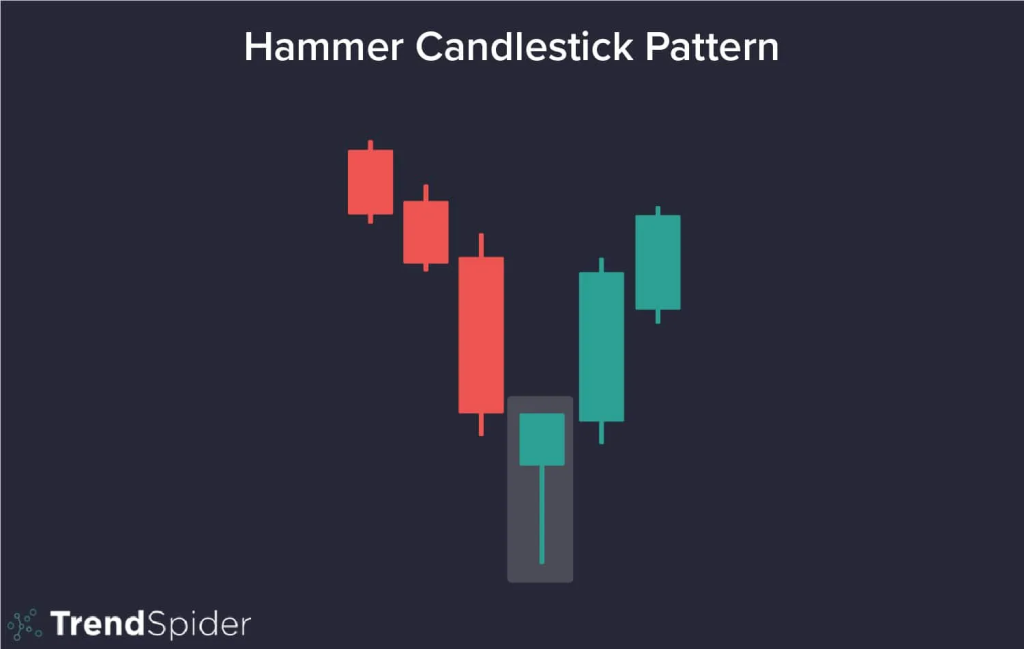
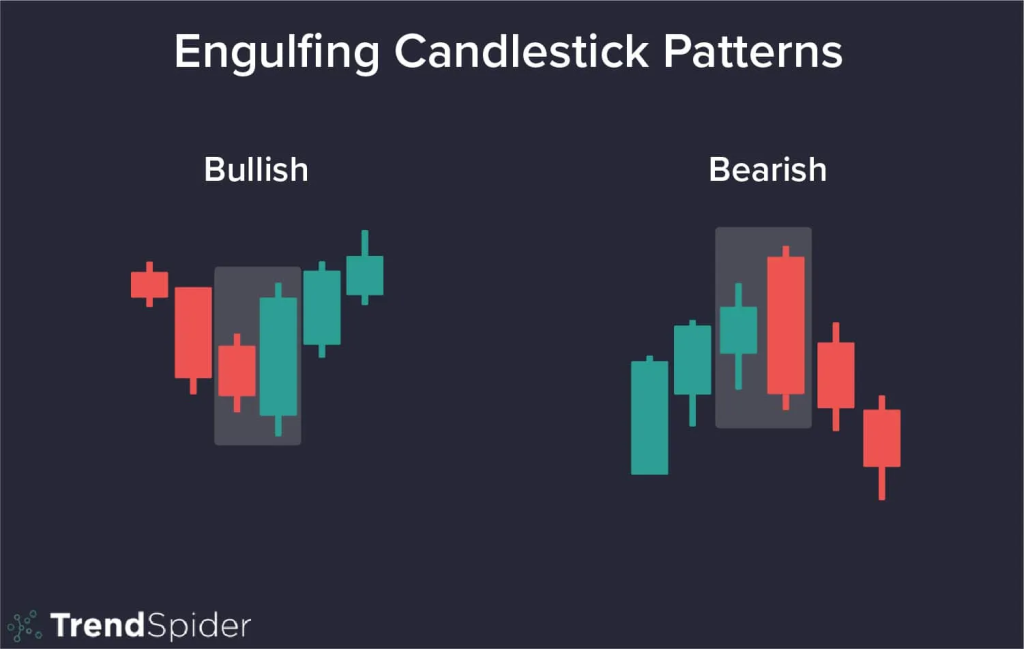
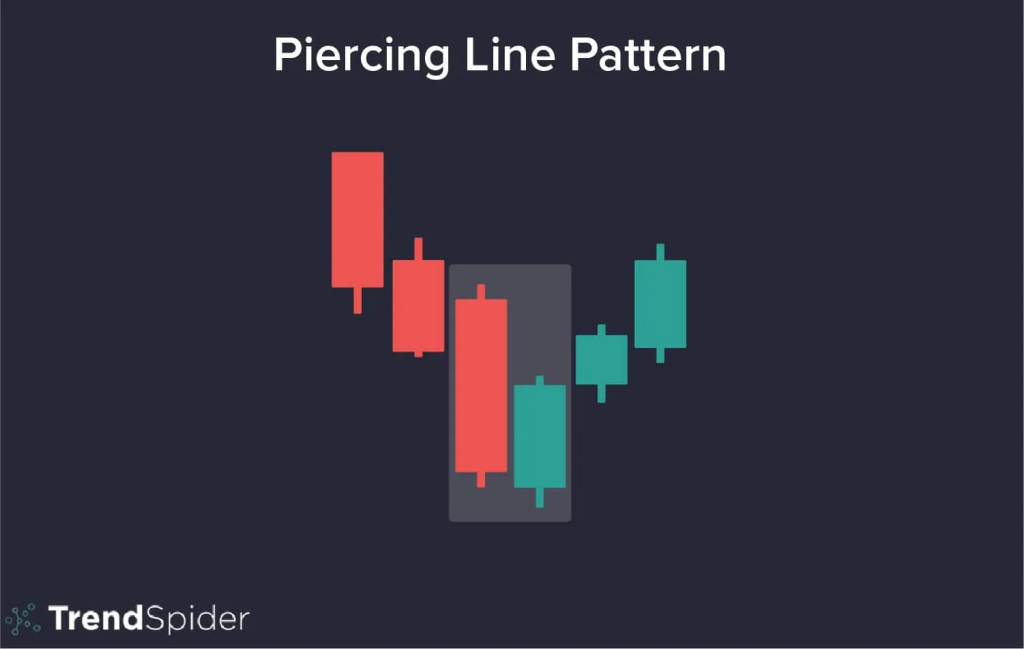
Chapter 10: Introduction to Candlestick Patterns


https://share.trendspider.com/chart/RF/13391amfnk9
Figure 38: Daily Chart Analysis- July 22, 2024 – March 14, 2025
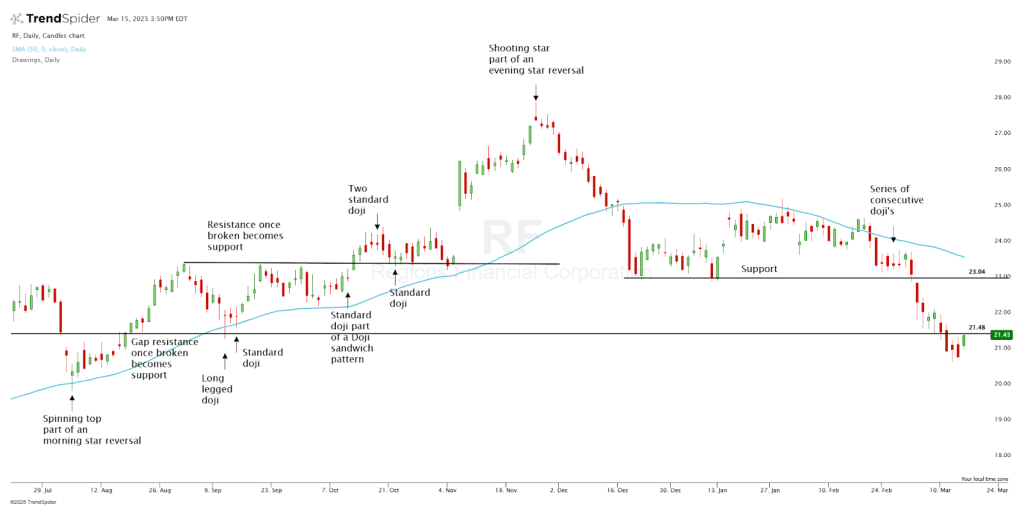
Regions Financial Corp. Chart Courtesy of TrendSpider


https://share.trendspider.com/chart/AG/13391aoezy1
Figure 40: Daily Chart Analysis- September 4, 2024 – March 14, 2025
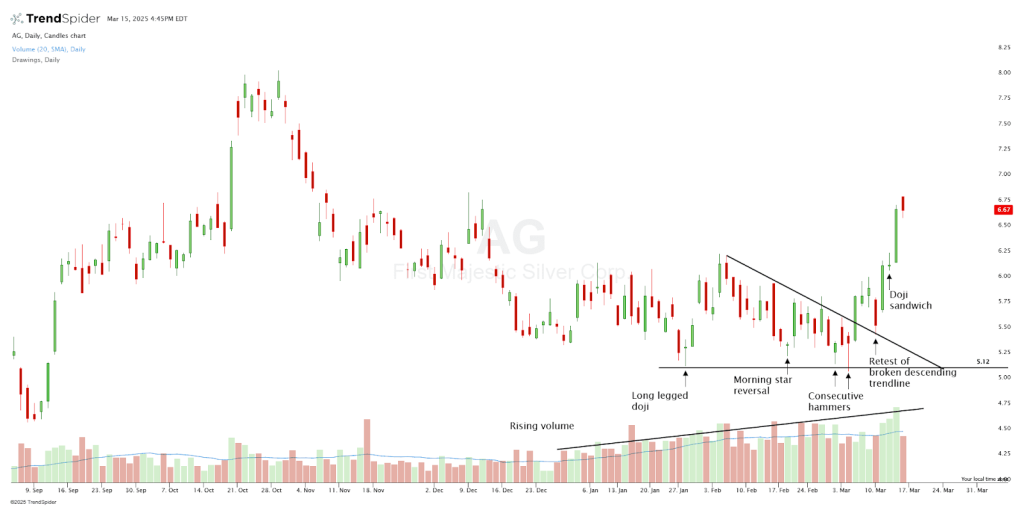
First Majestic Silver Corp (AG) Chart Courtesy of TrendSpider
 
 
https://trendspider.com/blog/what-is-a-hammer/
Figure 41: Inverted Hammer & Shooting Star Candles
 

https://share.trendspider.com/chart/SPY/13391cj2srs
Figure 42: Daily Chart Analysis- January 16, 2024 – November 1, 2024
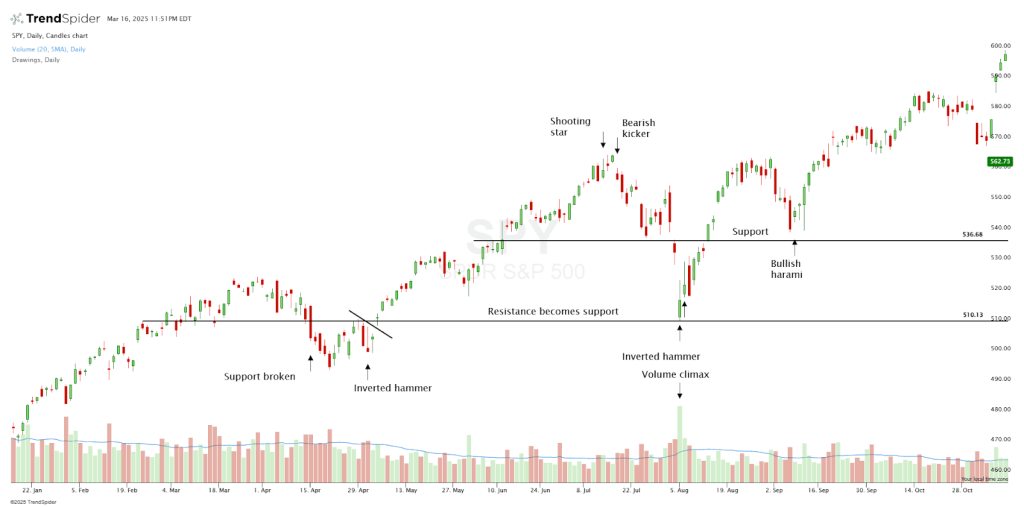
SPY Chart Courtesy of TrendSpider


https://share.trendspider.com/chart/FLNC/133917zq06e
Figure 44: Daily Chart Analysis- March 27, 2024 – February 6, 2025
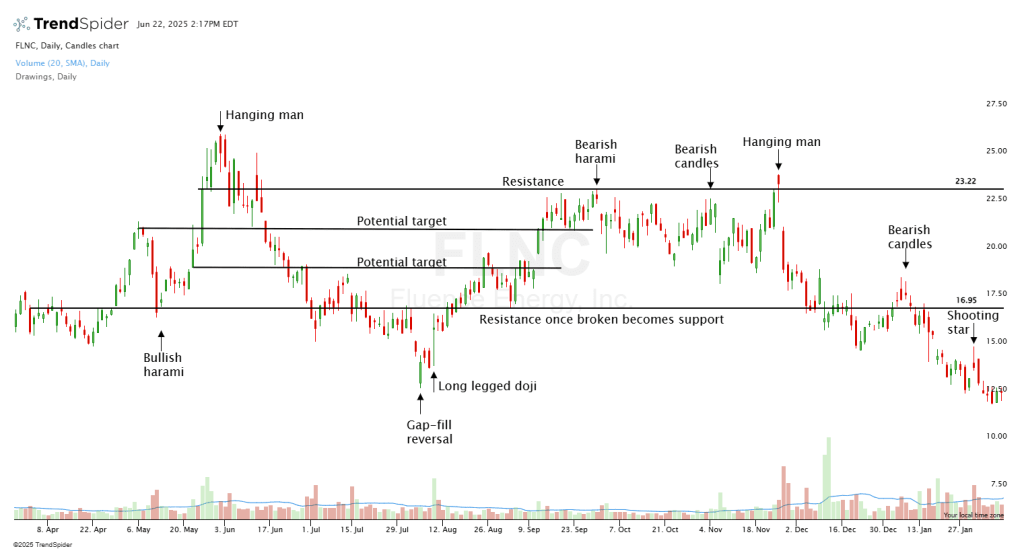
Fluence Energy, Inc. Chart Courtesy of TrendSpider

https://trendspider.com/learning-center/engulfing-candlestick-patterns-a-traders-guide/
Figure 45: Engulfing Candlestick Patterns
 

https://share.trendspider.com/chart/PENN/13391grxasr
Figure 46: 15-Minute Chart Analysis- March 10, 2025–March 19, 2025
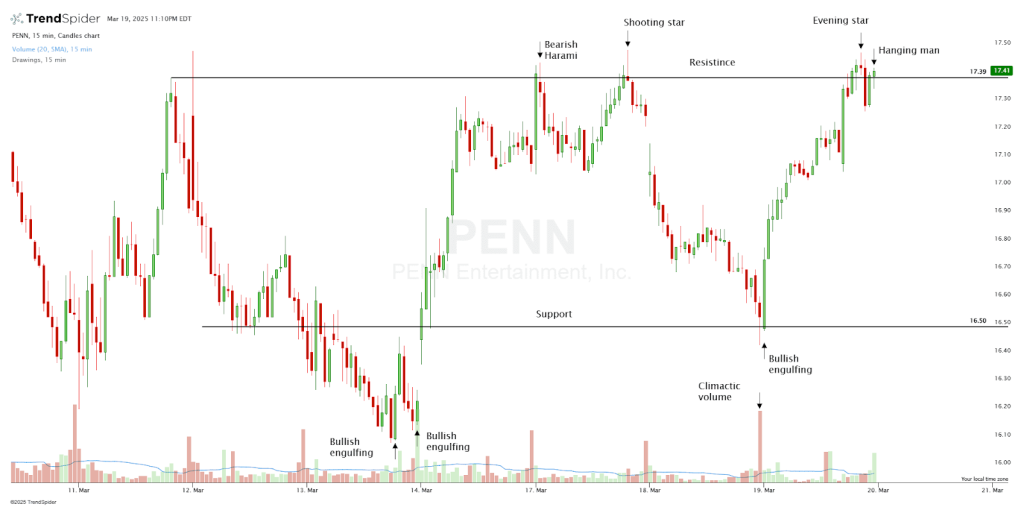
Penn Entertainment, Inc. Chart Courtesy of TrendSpider

https://share.trendspider.com/chart/DAL/13391m4lc6w
Figure 47: Daily Chart Analysis- July 25, 2025–March 21, 2025
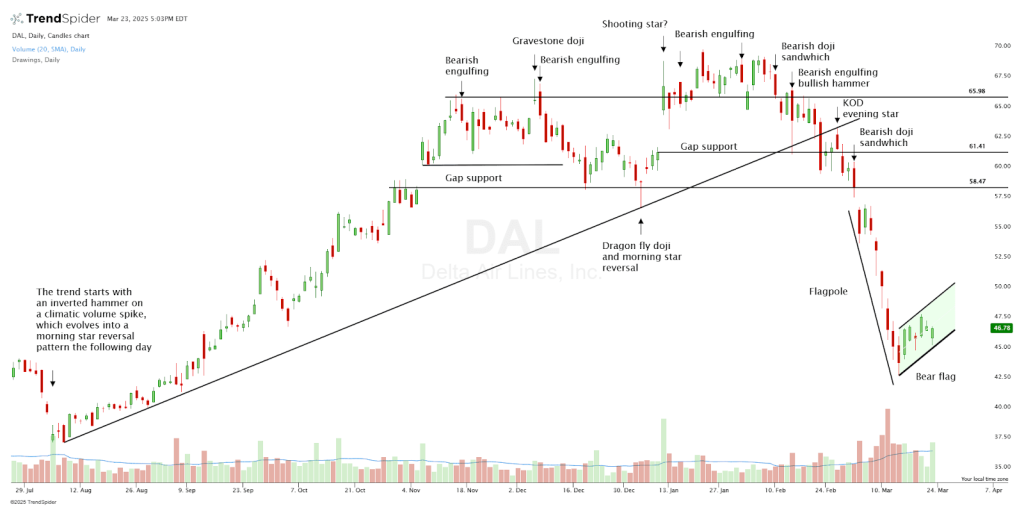
Delta Air Lines, Inc. Chart Courtesy of TrendSpider
 
 
https://share.trendspider.com/chart/CRWD/13391ukw7gw
Figure 49: Weekly Chart Analysis- July 2023–March 2025
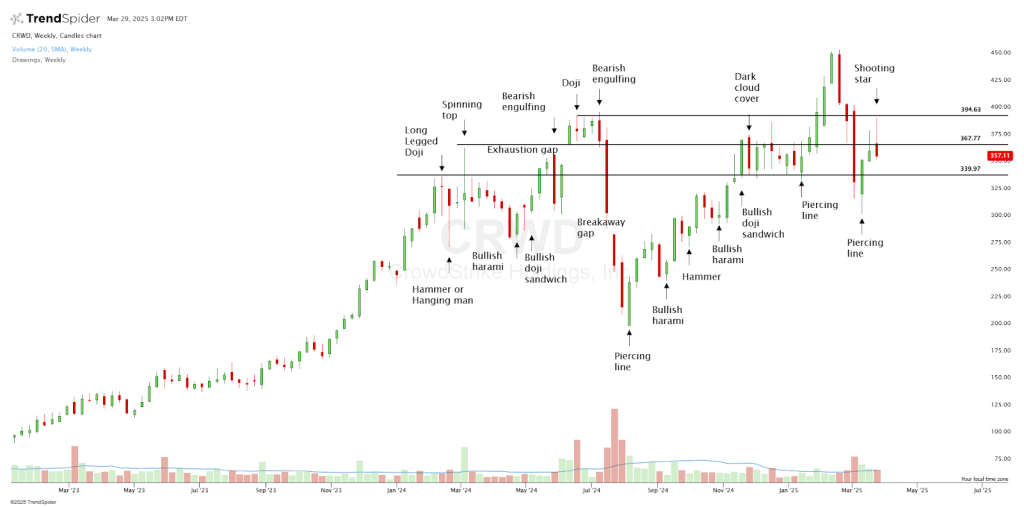
CrowdStrike Holdings, Inc. Chart Courtesy of TrendSpider


https://share.trendspider.com/chart/AES/13391v3zu7y
Figure 51: Weekly Chart Analysis-October 25, 2021 – March 24, 2025
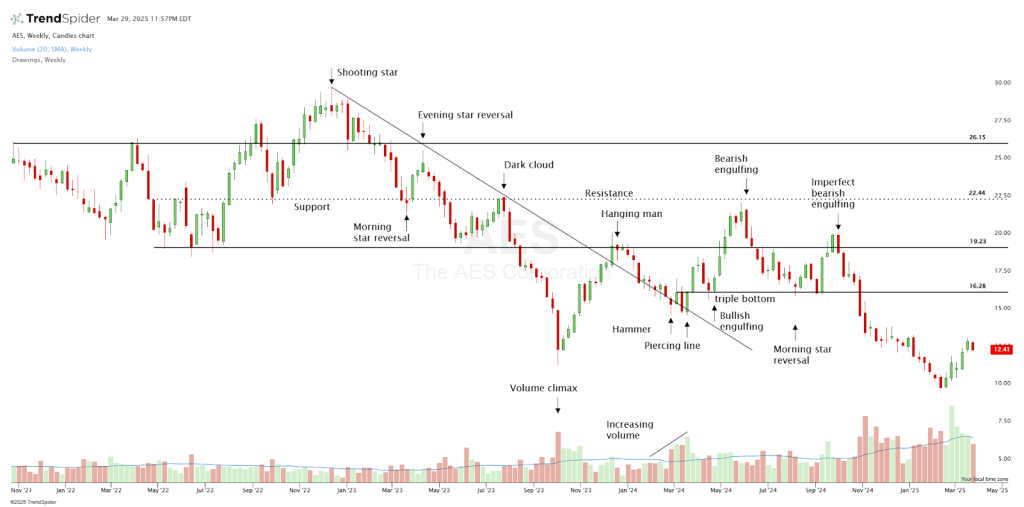
The AES Corporation Chart Courtesy of TrendSpider


https://share.trendspider.com/chart/AMZN/133914x5dj8
Figure 53: Daily Chart Analysis – June 14, 2024 – March 28, 2025
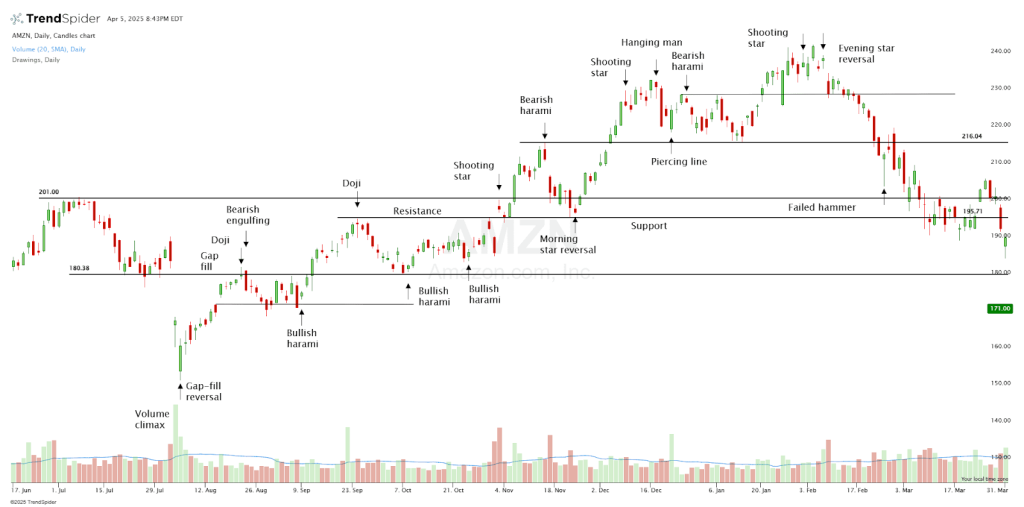
Amazon.com, Inc. Chart Courtesy of TrendSpider
 

https://share.trendspider.com/chart/CAT/133914woh57
Figure 54: Daily Chart Analysis-May 1, 2024 – April 1, 2025
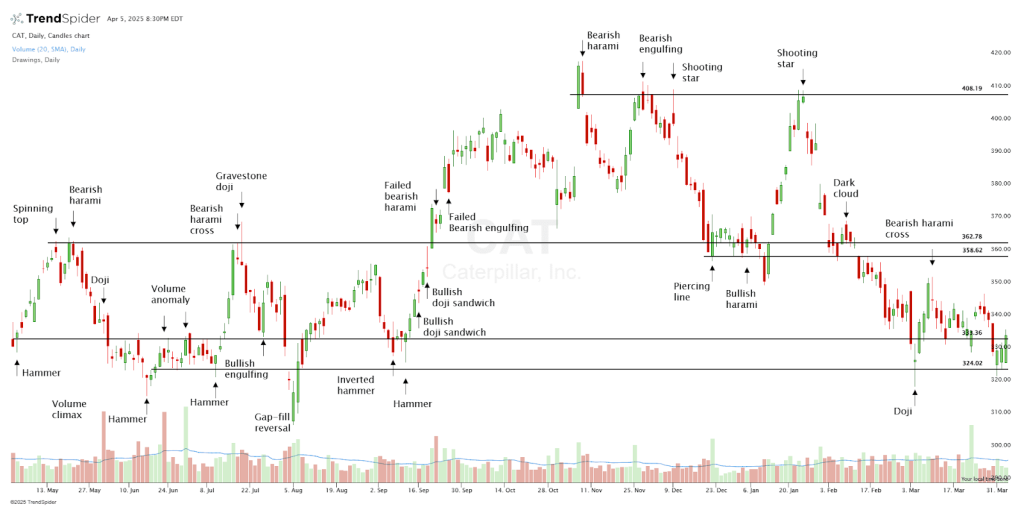
Caterpillar Inc. Chart Courtesy of TrendSpider
 

https://www.investopedia.com/terms/k/kickerpattern.asp
Figure 55: Bullish and Bearish Kicker Patterns
 

https://share.trendspider.com/chart/WY/13391caioh1
Figure 56: Daily Chart Analysis: May 13, 2024 – April 9, 2025
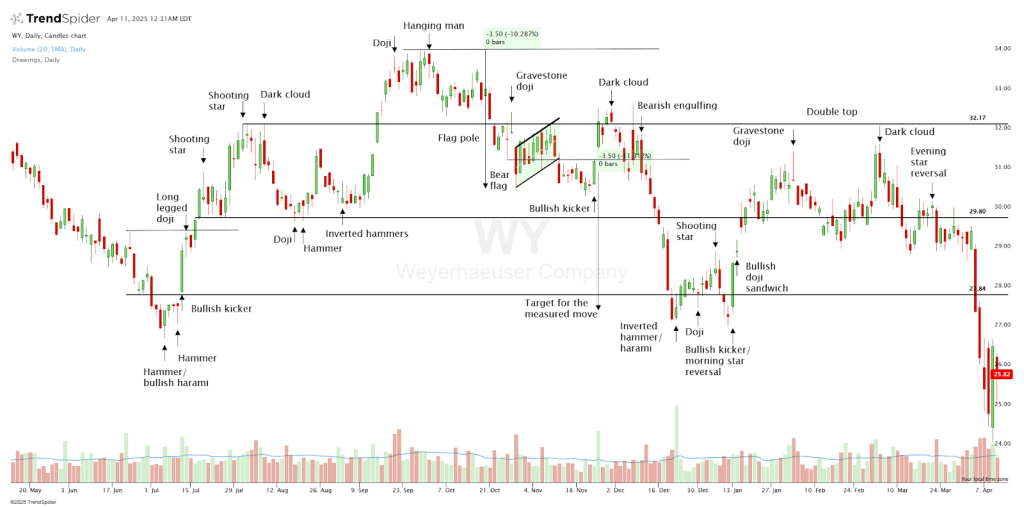
Weyerhaeuser Company Chart Courtesy of TrendSpider
 

https://share.trendspider.com/chart/MDT/13391g3i6z5
Figure 57: Daily Chart Analysis – May 6, 2024 – April 11, 2025
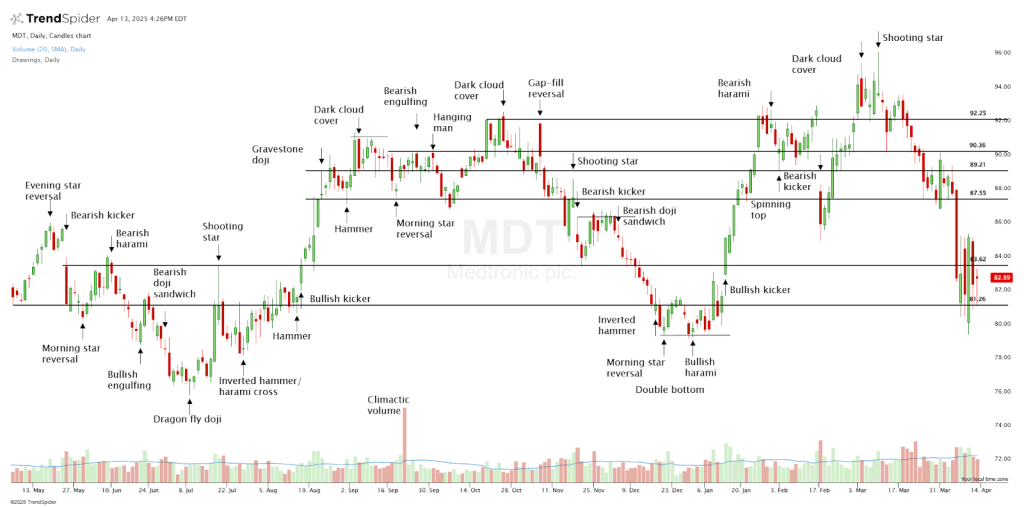
Medtronic Plc Chart Courtesy of TrendSpider


https://share.trendspider.com/chart/SMCI/13391p660rk
Figure 59: Daily Chart Analysis – July 23, 2024 – April 17, 2025
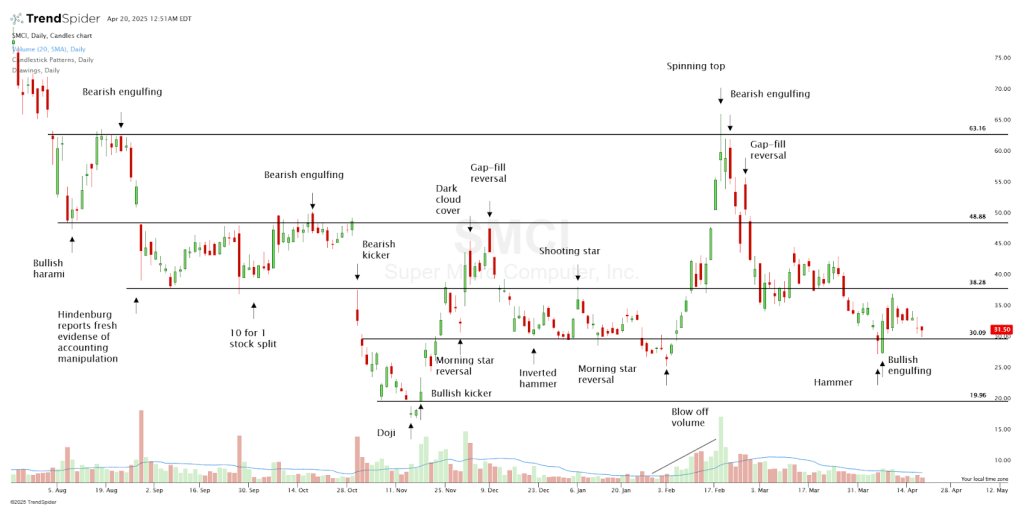
Super Micro Computer, Inc. Chart Courtesy of TrendSpider


https://share.trendspider.com/chart/FSLR/13391qjnyna
Figure 61: Daily Chart Analysis – March 5 2024 – April 17, 2025
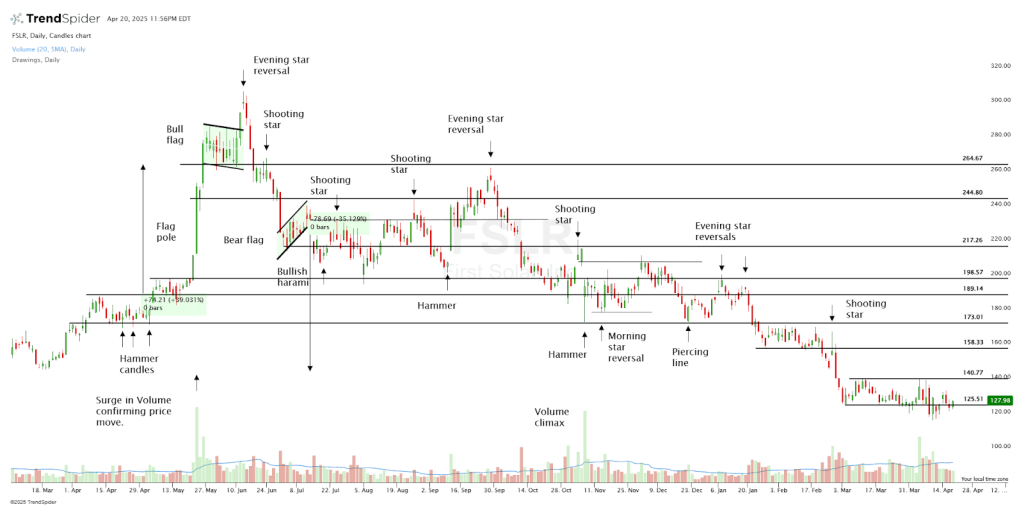
First Solar, Inc. Chart Courtesy of TrendSpider

Chapter 11: Chart Patterns and Trade Setups


https://share.trendspider.com/chart/JNJ/13391jn67na
Figure 63: Daily Chart Analysis – May 20, 2024 – April 22, 2025
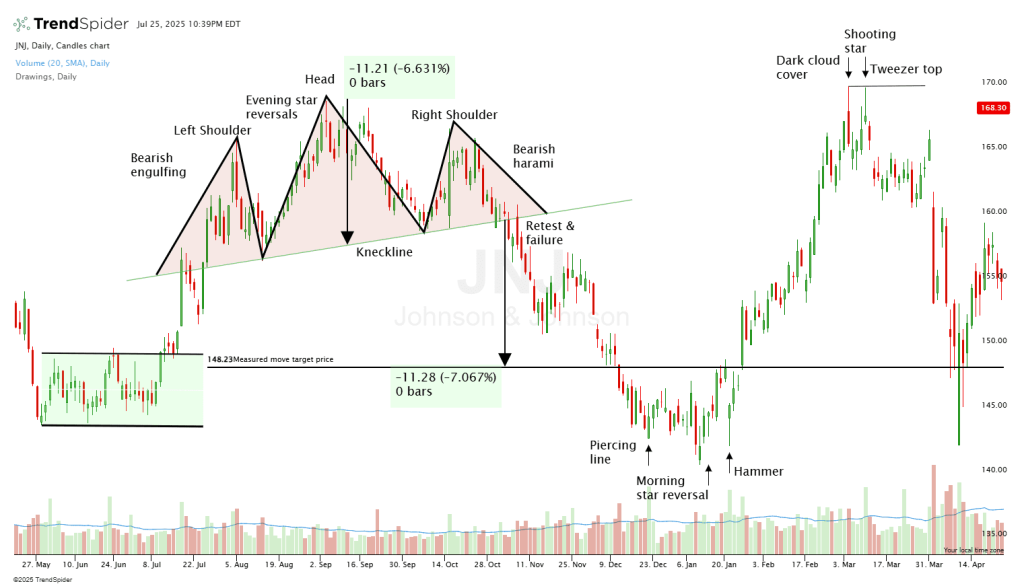
Johnson & Johnson Inc. Chart Courtesy of TrendSpider
 

https://share.trendspider.com/chart/XEL/13391lf4yvj
Figure 64: Daily Chart Analysis –September 19, 2024 – April 30, 2025
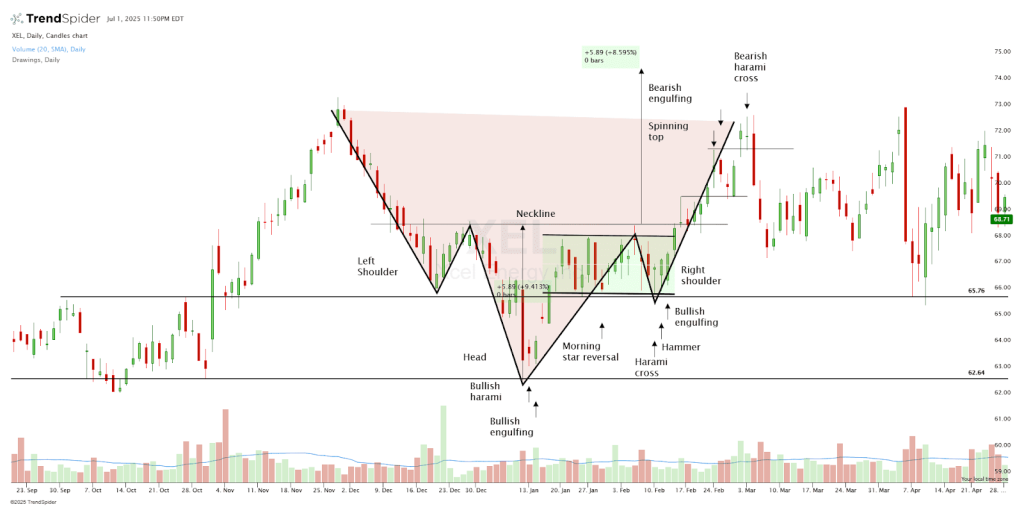
Excel Energy Inc. Chart Courtesy of TrendSpider
 

https://share.trendspider.com/chart/PPG/13391aco6wc
Figure 65: Daily Chart Analysis –November 24, 2023 – May 2, 2025
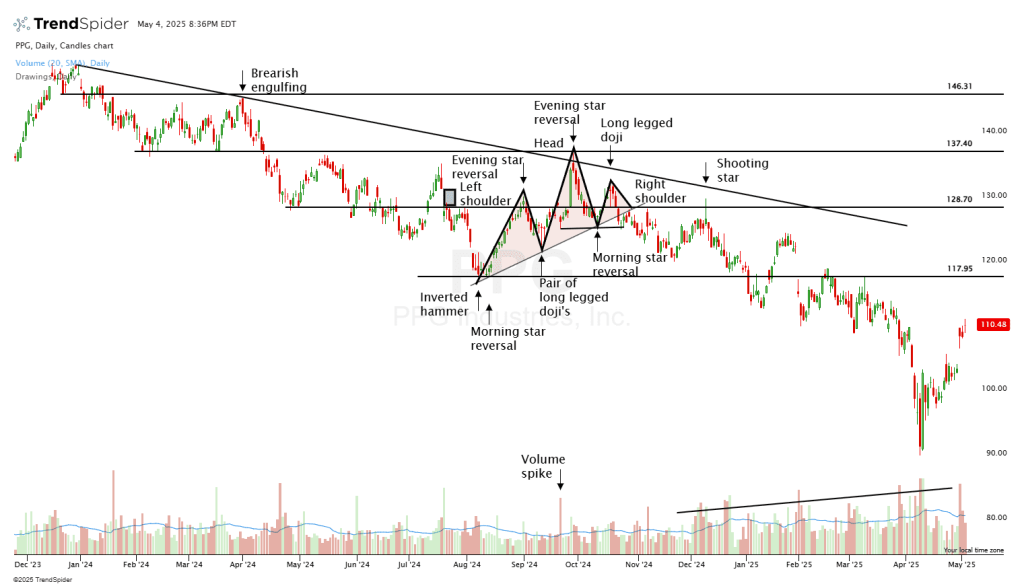
PPG Industries Chart Courtesy of TrendSpider
 

https://share.trendspider.com/chart/REG/13391f9ryom
Figure 66: Daily Chart Analysis –November 22, 2023 – May 7, 2025
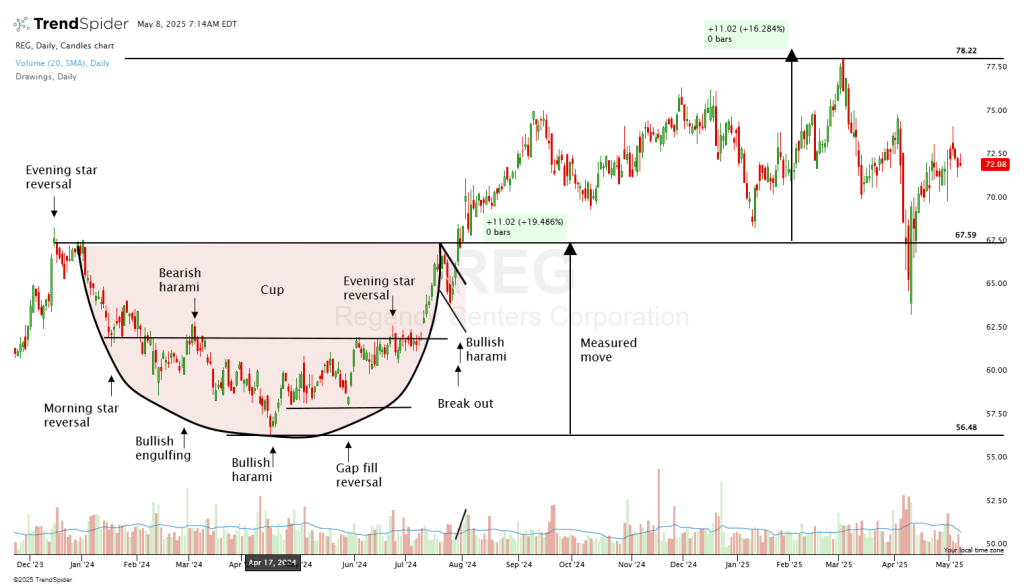
Regency Centers Corporation Chart Courtesy of TrendSpider
 
https://share.trendspider.com/chart/ROK/13391kmhr3h
Figure 67: Hourly Chart Analysis –March 7, 2025 10:30 am EST – May 9, 2025 1:30 pm EST
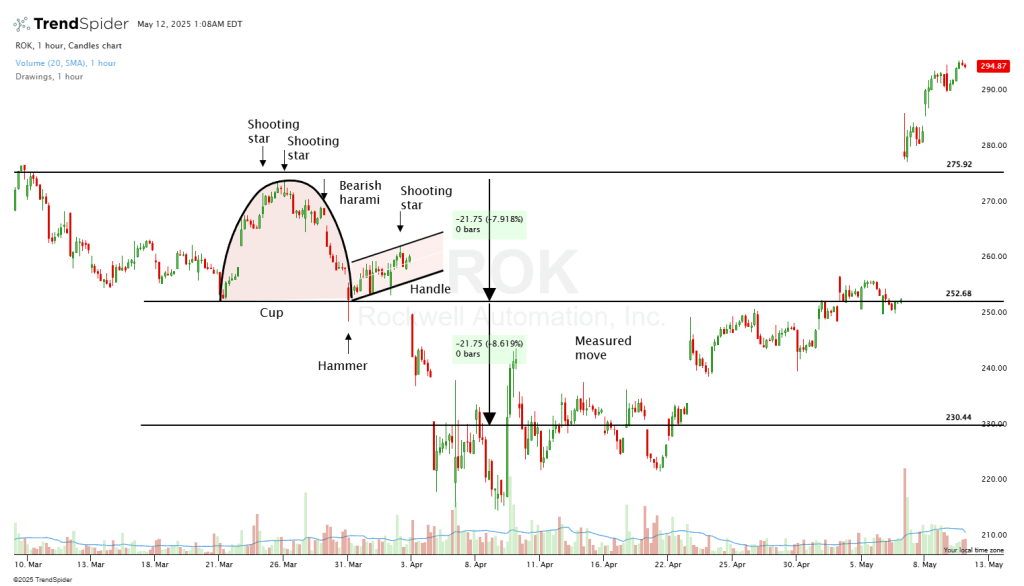
Rockwell Automation Chart Courtesy of TrendSpider
 

https://share.trendspider.com/chart/ROL/13391qd26ak
Figure 68: Daily Chart Analysis –May 23, 2024 – May 13, 2025
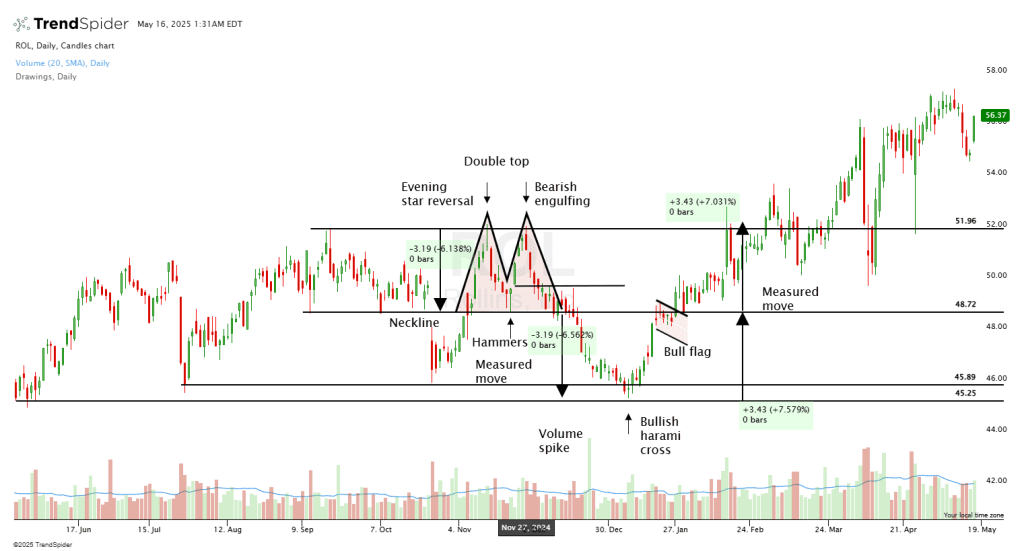
Rollins, Inc. Chart Courtesy of TrendSpider
 

https://share.trendspider.com/chart/POET/13391rrtbfp
Figure 69: Daily Chart Analysis –August 16, 2024 – May 16, 2025
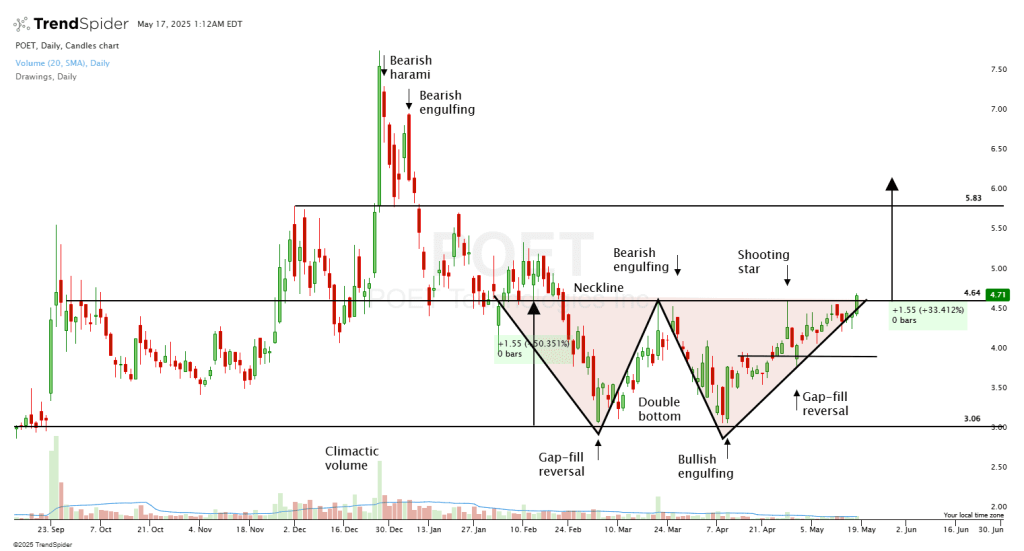
POET Technology, Inc. Chart Courtesy of TrendSpider
 

https://share.trendspider.com/chart/ANET/1339132jcbn
Figure 70: Daily Chart Analysis –June 12, 2024 – May 22, 2025
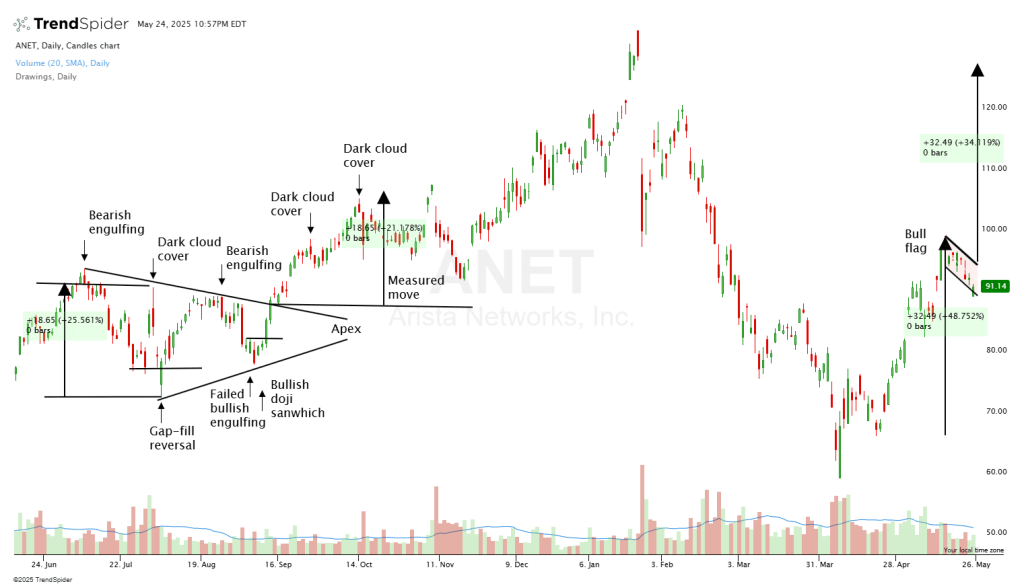
Arista Networks, Inc. Chart Courtesy of TrendSpider
 

https://share.trendspider.com/chart/C/1339144fzyg
Figure 71: Daily Chart Analysis –June 13, 2024 – May 22, 2025
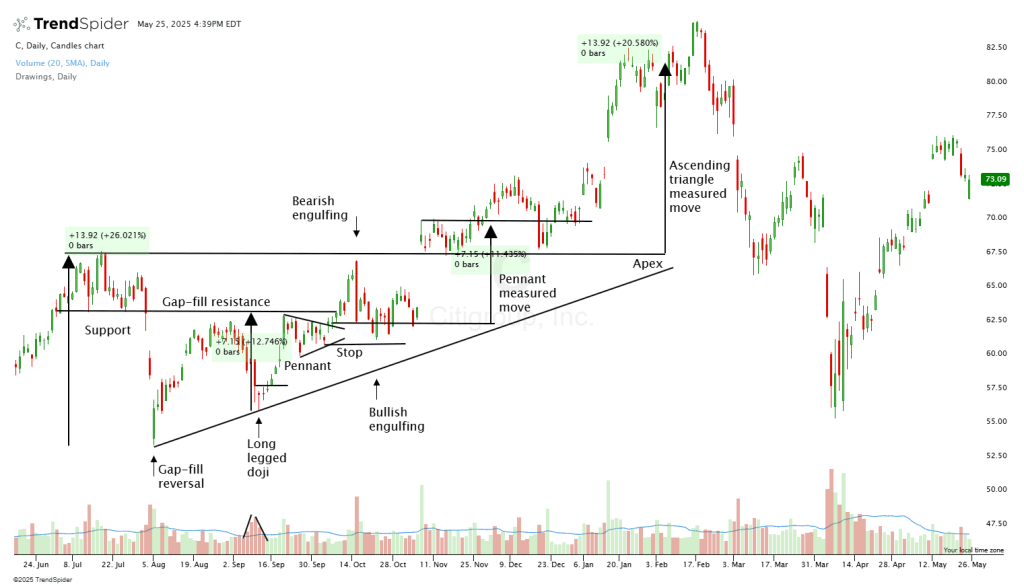
Citigroup, Inc. Chart Courtesy of TrendSpider
 
https://share.trendspider.com/chart/ALGN/133915p2863
Figure 72: Daily Chart Analysis –May 30, 2024 – May 23, 2025
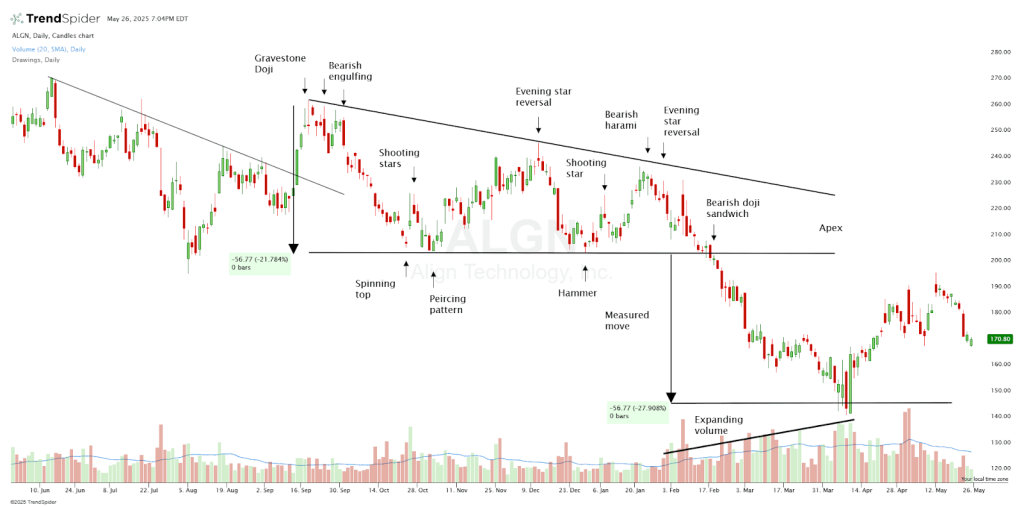
Align Technology, Inc Chart Courtesy of TrendSpider
 

https://share.trendspider.com/chart/ERIE/13391acocme
Figure 73: Daily Chart Analysis –April 11, 2024 – September 16, 2024
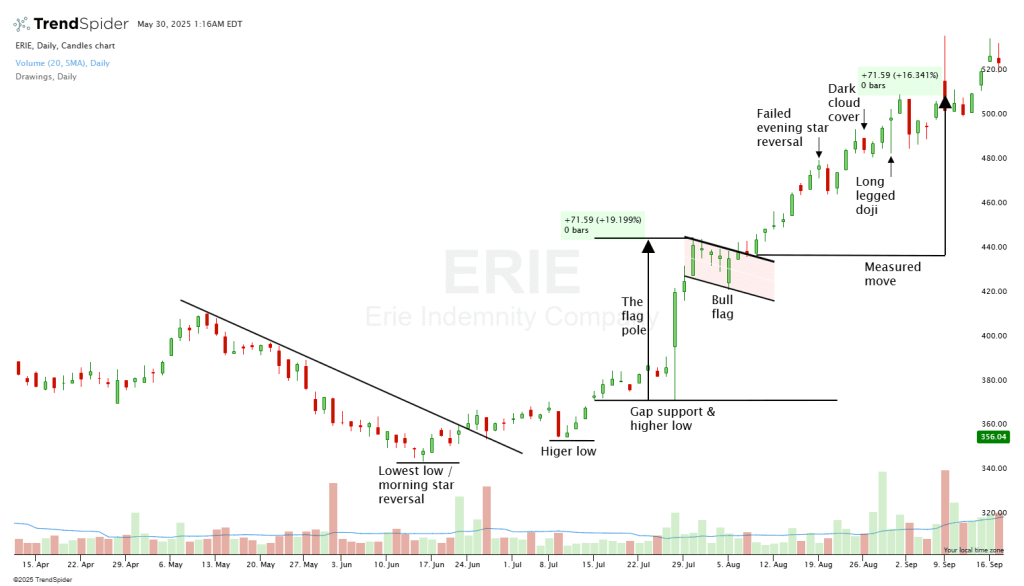
Erie Indemnity Company Chart Courtesy of TrendSpider
 
https://share.trendspider.com/chart/BA/13391co4xem
Figure 74: Daily Chart Analysis –September 6, 2024 – May 30, 2025
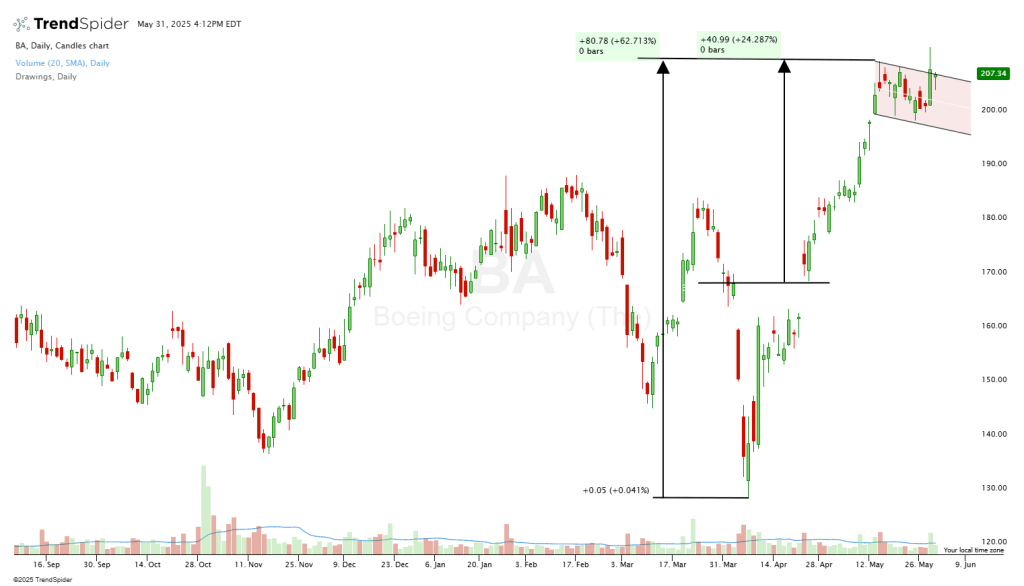
Boeing Company Chart Courtesy of TrendSpider
 

https://share.trendspider.com/chart/EIX/13391cufg0b
Figure 75: Daily Chart Analysis –August 12, 2024 – May 30, 2025
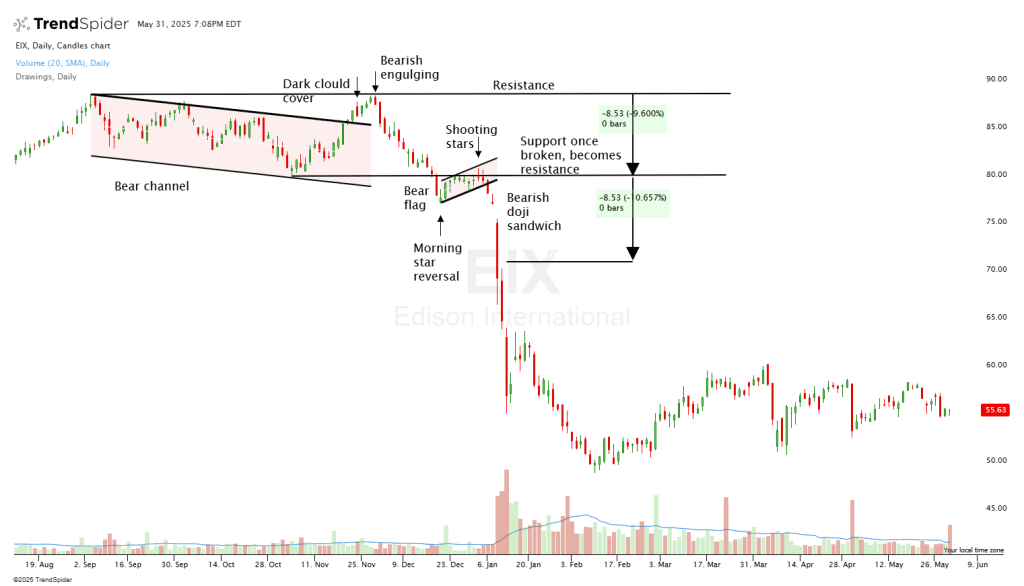
Edison International Chart Courtesy of TrendSpider
 

https://share.trendspider.com/chart/CSCO/13391edcdfs
Figure 76: Daily Chart Analysis –July 24, 2024 – May 30, 2025
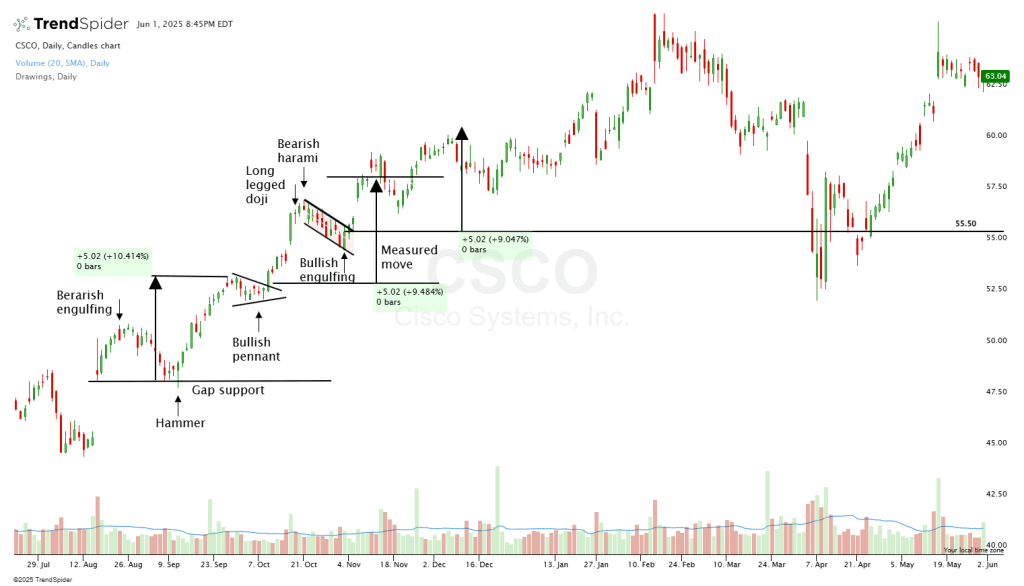
Cisco Systems Chart Courtesy of TrendSpider
 

https://share.trendspider.com/chart/ETN/13391n29e4x
Figure 77: Daily Chart Analysis –August 8, 2024 – June 6, 2025
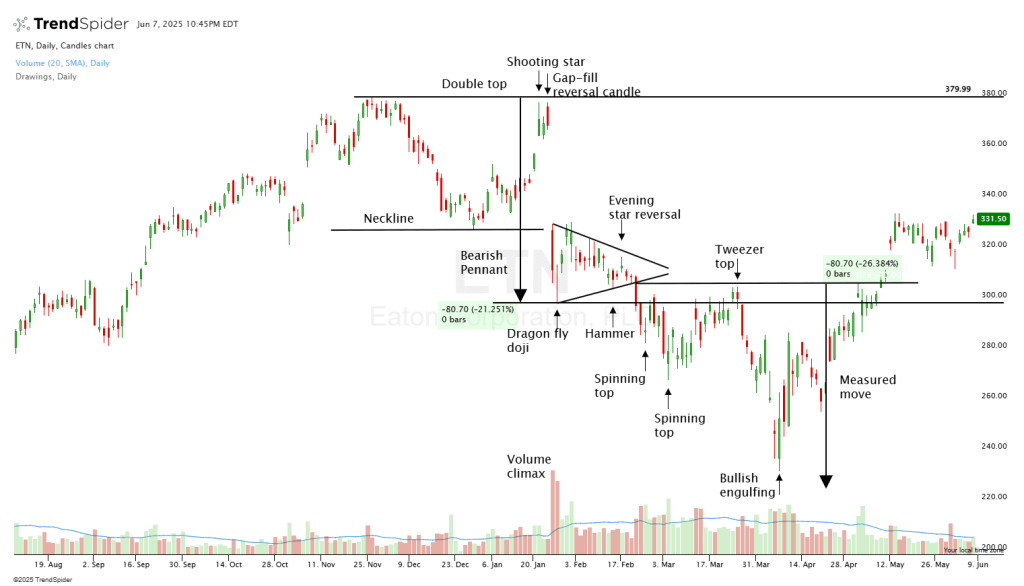
Eaton Corporation, PLC Chart Courtesy of TrendSpider
 

https://share.trendspider.com/chart/NVDA/13391o57c61
Figure 78: Daily Chart Analysis –October 30, 2024 – June 6, 2025
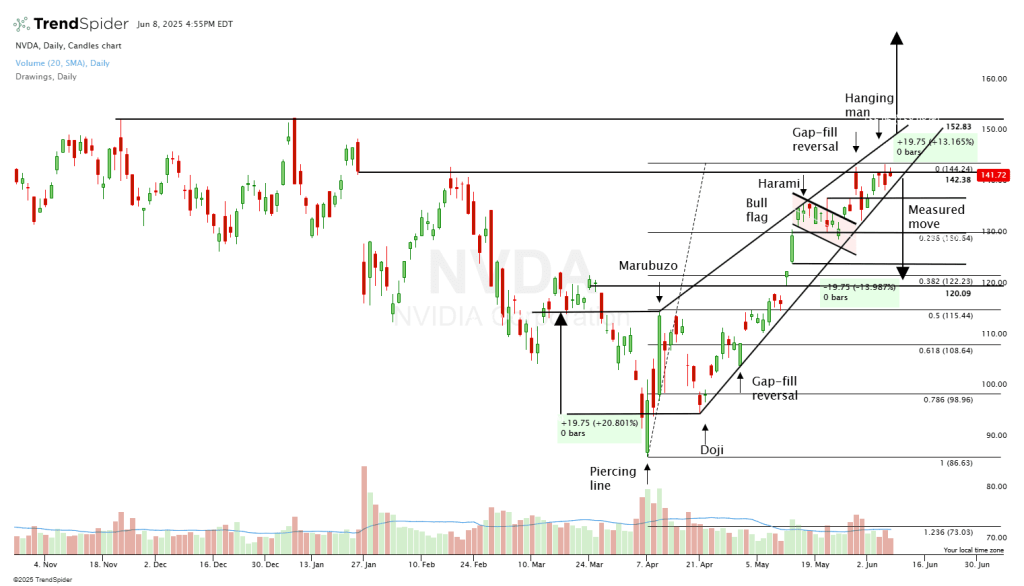
NVIDIA Corporation Chart Courtesy of TrendSpider
 

https://share.trendspider.com/chart/KHC/13391o9i31x
Figure 79: Daily Chart Analysis –October 10, 2024 – June 6, 2025
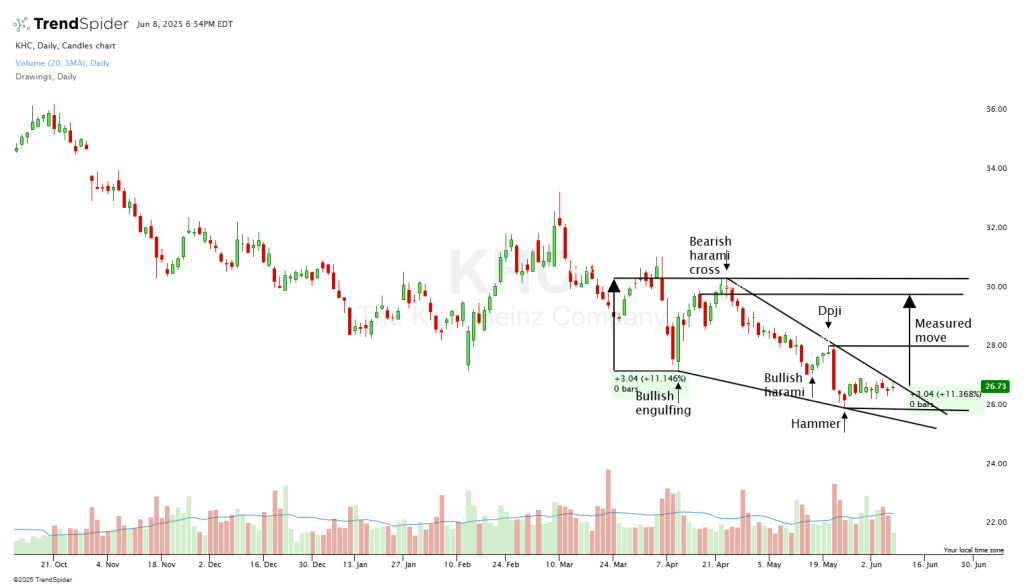
Kraft Heinz Company Chart Courtesy of TrendSpider
 

https://share.trendspider.com/chart/DIS/13391oai3ye
Figure 80: Daily Chart Analysis –October 10, 2024 – June 6, 2025
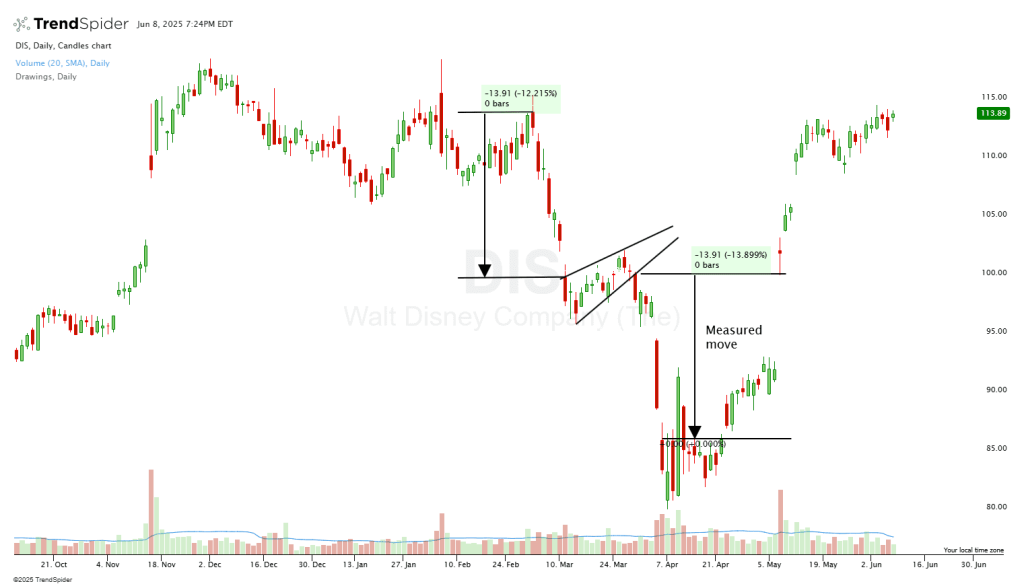
Walt Disney Company Chart Courtesy of TrendSpider